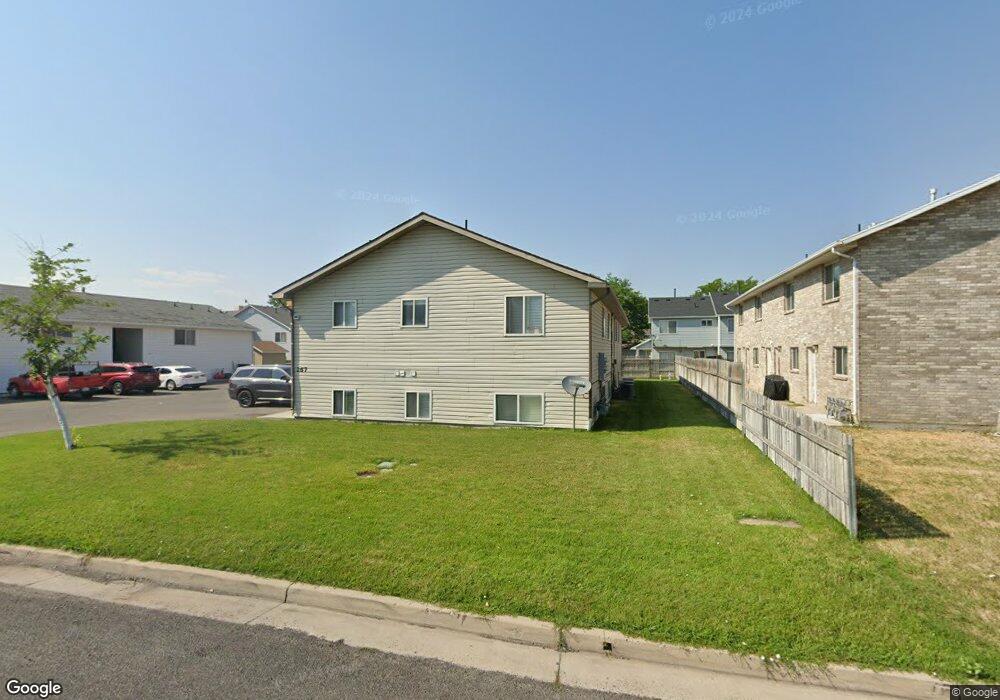
267 W 1100 N Logan, UT 84341
Bridger NeighborhoodEstimated Value: $730,000 - $842,000
12
Beds
4
Baths
4,376
Sq Ft
$179/Sq Ft
Est. Value
About This Home
This home is located at 267 W 1100 N, Logan, UT 84341 and is currently estimated at $782,702, approximately $178 per square foot. 267 W 1100 N is a home located in Cache County with nearby schools including Bridger School, Mount Logan Middle School, and Logan High School.
Ownership History
Date
Name
Owned For
Owner Type
Purchase Details
Closed on
Sep 13, 2013
Sold by
Burtenshaw Tyson
Bought by
Burtenshaw Tyson and Burtenshaw Mckayla
Current Estimated Value
Home Financials for this Owner
Home Financials are based on the most recent Mortgage that was taken out on this home.
Original Mortgage
$302,421
Outstanding Balance
$217,399
Interest Rate
3.5%
Mortgage Type
FHA
Estimated Equity
$565,303
Purchase Details
Closed on
May 16, 2007
Sold by
Hansen Margaret G
Bought by
Williams Keith S and Williams Nilda R
Home Financials for this Owner
Home Financials are based on the most recent Mortgage that was taken out on this home.
Original Mortgage
$21,000
Interest Rate
6.18%
Mortgage Type
Stand Alone Second
Create a Home Valuation Report for This Property
The Home Valuation Report is an in-depth analysis detailing your home's value as well as a comparison with similar homes in the area
Home Values in the Area
Average Home Value in this Area
Purchase History
| Date | Buyer | Sale Price | Title Company |
|---|---|---|---|
| Burtenshaw Tyson | -- | Heritage Title | |
| Burtenshaw Tyson | -- | Heritage Title | |
| Williams Keith S | -- | First American Title Company |
Source: Public Records
Mortgage History
| Date | Status | Borrower | Loan Amount |
|---|---|---|---|
| Open | Burtenshaw Tyson | $302,421 | |
| Previous Owner | Williams Keith S | $21,000 | |
| Previous Owner | Williams Keith S | $225,700 |
Source: Public Records
Tax History Compared to Growth
Tax History
| Year | Tax Paid | Tax Assessment Tax Assessment Total Assessment is a certain percentage of the fair market value that is determined by local assessors to be the total taxable value of land and additions on the property. | Land | Improvement |
|---|---|---|---|---|
| 2024 | $3,371 | $767,760 | $219,300 | $548,460 |
| 2023 | $3,517 | $763,460 | $215,000 | $548,460 |
| 2022 | $3,359 | $680,860 | $132,400 | $548,460 |
| 2021 | $3,663 | $631,000 | $132,400 | $498,600 |
| 2020 | $2,734 | $423,800 | $90,000 | $333,800 |
| 2019 | $2,857 | $423,800 | $90,000 | $333,800 |
| 2018 | $2,871 | $388,780 | $70,000 | $318,780 |
| 2017 | $2,725 | $195,140 | $0 | $0 |
| 2016 | $2,826 | $169,840 | $0 | $0 |
| 2015 | $2,462 | $169,840 | $0 | $0 |
| 2014 | $2,226 | $169,840 | $0 | $0 |
| 2013 | $1,994 | $151,590 | $0 | $0 |
Source: Public Records
Map
Nearby Homes