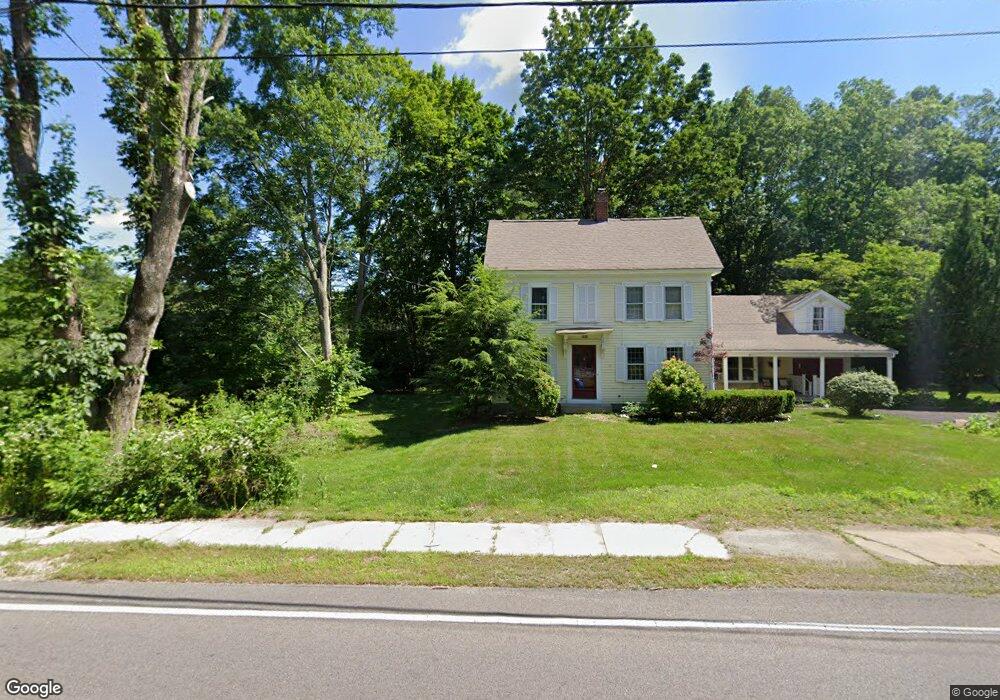
267 West St East Bridgewater, MA 02333
Estimated Value: $519,000 - $2,264,000
3
Beds
1
Bath
960
Sq Ft
$1,003/Sq Ft
Est. Value
About This Home
This home is located at 267 West St, East Bridgewater, MA 02333 and is currently estimated at $963,226, approximately $1,003 per square foot. 267 West St is a home located in Plymouth County with nearby schools including Gordon W Mitchell Middle School and East Bridgewater Jr./Sr. High School.
Ownership History
Date
Name
Owned For
Owner Type
Purchase Details
Closed on
Aug 14, 2001
Sold by
Smith Robert C and Smith Jennifer M
Bought by
Healey John M and Steele Jacqueline M
Current Estimated Value
Home Financials for this Owner
Home Financials are based on the most recent Mortgage that was taken out on this home.
Original Mortgage
$207,313
Interest Rate
7.1%
Mortgage Type
Purchase Money Mortgage
Purchase Details
Closed on
May 30, 1996
Sold by
Belisle Eugene G and Belisle Louise M
Bought by
Smith Robert C and Boisvert Jennifer M
Purchase Details
Closed on
Mar 18, 1994
Sold by
Continental Inv T and Alfonso Joseph F
Bought by
Belisle Eugene G and Belisle Louise M
Create a Home Valuation Report for This Property
The Home Valuation Report is an in-depth analysis detailing your home's value as well as a comparison with similar homes in the area
Home Values in the Area
Average Home Value in this Area
Purchase History
| Date | Buyer | Sale Price | Title Company |
|---|---|---|---|
| Healey John M | $215,000 | -- | |
| Smith Robert C | $147,500 | -- | |
| Belisle Eugene G | $144,900 | -- |
Source: Public Records
Mortgage History
| Date | Status | Borrower | Loan Amount |
|---|---|---|---|
| Open | Belisle Eugene G | $266,000 | |
| Closed | Belisle Eugene G | $19,000 | |
| Closed | Belisle Eugene G | $207,313 |
Source: Public Records
Tax History Compared to Growth
Tax History
| Year | Tax Paid | Tax Assessment Tax Assessment Total Assessment is a certain percentage of the fair market value that is determined by local assessors to be the total taxable value of land and additions on the property. | Land | Improvement |
|---|---|---|---|---|
| 2025 | $6,083 | $445,000 | $192,500 | $252,500 |
| 2024 | $5,924 | $428,000 | $185,100 | $242,900 |
| 2023 | $5,875 | $406,600 | $185,100 | $221,500 |
| 2022 | $5,568 | $356,900 | $168,400 | $188,500 |
| 2021 | $5,222 | $306,300 | $153,600 | $152,700 |
| 2020 | $5,024 | $290,600 | $141,800 | $148,800 |
| 2019 | $4,869 | $277,300 | $135,500 | $141,800 |
| 2018 | $4,585 | $255,300 | $128,000 | $127,300 |
| 2017 | $4,482 | $244,900 | $122,000 | $122,900 |
| 2016 | $4,464 | $245,800 | $129,200 | $116,600 |
| 2015 | $4,765 | $268,300 | $150,000 | $118,300 |
| 2014 | $4,594 | $264,500 | $146,800 | $117,700 |
Source: Public Records
Map
Nearby Homes
- 590 Bedford St
- 391 Bedford St
- 386 Bedford St
- 245-r Laurel St
- 324 W Union St
- 603 East St
- 6 Andrea Way
- 580 Broad St Unit 1
- 580 Broad St Unit 2
- 505 N Central St
- 16 Pearl St
- 54 Plymouth St
- 11 Willow Ave
- 22 Water St
- 60 Miranda Way
- 479 Central St
- 11 Harmony Crossing
- 81 Arrowhead Dr
- 192 S Main St
- 386 Matfield St