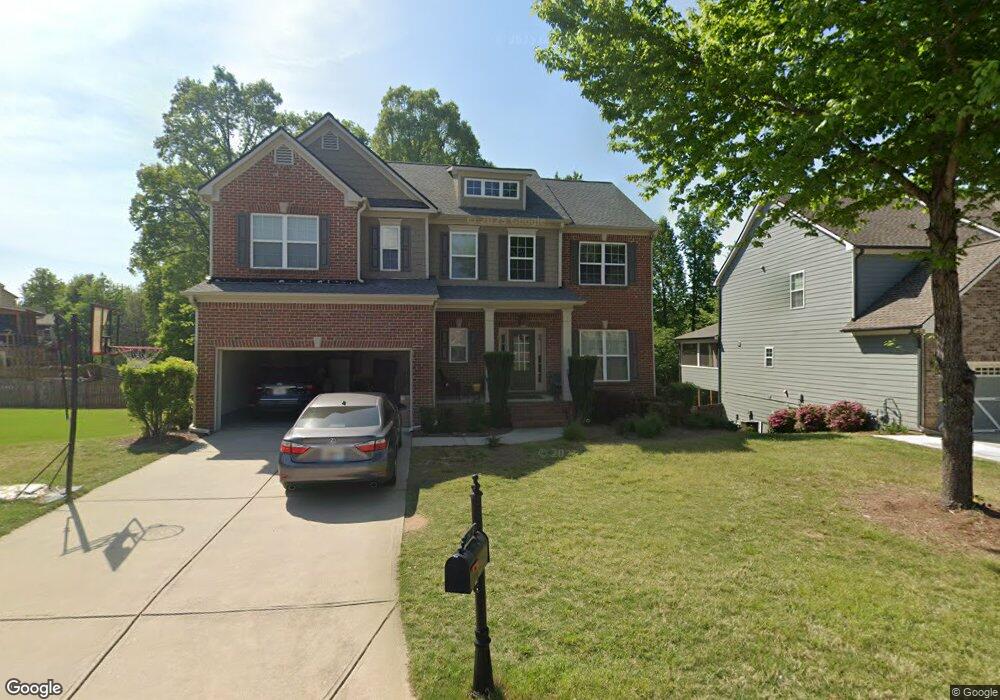
2670 Blackstock Dr Cumming, GA 30041
Estimated Value: $578,000 - $679,000
4
Beds
3
Baths
2,615
Sq Ft
$242/Sq Ft
Est. Value
About This Home
This home is located at 2670 Blackstock Dr, Cumming, GA 30041 and is currently estimated at $633,653, approximately $242 per square foot. 2670 Blackstock Dr is a home located in Forsyth County with nearby schools including Haw Creek Elementary School, Lakeside Middle School, and South Forsyth High School.
Ownership History
Date
Name
Owned For
Owner Type
Purchase Details
Closed on
Nov 13, 2009
Sold by
Singh Amitabh K
Bought by
Singh Amitabh K and Singh Archana
Current Estimated Value
Home Financials for this Owner
Home Financials are based on the most recent Mortgage that was taken out on this home.
Original Mortgage
$242,034
Outstanding Balance
$158,119
Interest Rate
5.01%
Mortgage Type
FHA
Estimated Equity
$475,534
Purchase Details
Closed on
Jul 31, 2008
Sold by
Mccar Homes Inc
Bought by
Bradley Danny A and Bradley Heather S
Home Financials for this Owner
Home Financials are based on the most recent Mortgage that was taken out on this home.
Original Mortgage
$245,348
Interest Rate
6.43%
Mortgage Type
New Conventional
Purchase Details
Closed on
Oct 5, 2005
Sold by
Mdc Land Devel Three
Bought by
Mccar Homes Inc
Create a Home Valuation Report for This Property
The Home Valuation Report is an in-depth analysis detailing your home's value as well as a comparison with similar homes in the area
Home Values in the Area
Average Home Value in this Area
Purchase History
| Date | Buyer | Sale Price | Title Company |
|---|---|---|---|
| Singh Amitabh K | -- | -- | |
| Singh Amitabh K | $246,500 | -- | |
| Prudential Relocation Inc | $246,600 | -- | |
| Bradley Danny A | $272,700 | -- | |
| Mccar Homes Inc | $590,000 | -- |
Source: Public Records
Mortgage History
| Date | Status | Borrower | Loan Amount |
|---|---|---|---|
| Open | Prudential Relocation Inc | $242,034 | |
| Previous Owner | Bradley Danny A | $245,348 |
Source: Public Records
Tax History Compared to Growth
Tax History
| Year | Tax Paid | Tax Assessment Tax Assessment Total Assessment is a certain percentage of the fair market value that is determined by local assessors to be the total taxable value of land and additions on the property. | Land | Improvement |
|---|---|---|---|---|
| 2025 | $4,775 | $254,200 | $72,000 | $182,200 |
| 2024 | $4,775 | $237,184 | $60,000 | $177,184 |
| 2023 | $4,137 | $219,924 | $60,000 | $159,924 |
| 2022 | $4,050 | $135,784 | $32,000 | $103,784 |
| 2021 | $3,456 | $135,784 | $32,000 | $103,784 |
| 2020 | $3,478 | $136,832 | $32,000 | $104,832 |
| 2019 | $3,525 | $138,840 | $32,000 | $106,840 |
| 2018 | $3,392 | $131,884 | $28,000 | $103,884 |
| 2017 | $3,185 | $121,460 | $28,000 | $93,460 |
| 2016 | $3,187 | $121,540 | $26,000 | $95,540 |
| 2015 | $3,018 | $113,260 | $26,000 | $87,260 |
| 2014 | $2,514 | $98,268 | $26,000 | $72,268 |
Source: Public Records
Map
Nearby Homes
- 2640 Blackstock Dr
- 2625 Blackstock Dr
- 2410 Overpass
- 3030 Blackstock Dr
- Belville Plan at The Glade
- Manchester Plan at The Glade
- Milton Plan at The Glade
- 5613 Lancashire Ln
- 2350 Gladstone Place
- 2216 Trammel Rd
- 2400 Gants Hill Place
- Lot 8 Cambridge Hills Rd
- 5303 Davenport Manor
- 1458 Edenfield Pointe
- 1458 Edenfield Pte
- 2540 Marsha Cir
- 5349 Davenport Manor
- 6143 Menlow Ct
- 5985 Marlow Dr
- 2675 Blackstock Dr
- 2660 Blackstock Dr
- 2680 Blackstock Dr
- 2665 Blackstock Dr
- 2685 Blackstock Dr
- 2650 Blackstock Dr
- 2655 Blackstock Dr
- 2720 Irwin Ct
- 0 Irwin Ct Unit 8032411
- 0 Irwin Ct Unit 8386992
- 2705 Irwin Ct
- 2645 Blackstock Dr
- 2715 Blackstock Dr
- 2730 Irwin Ct
- 2725 Irwin Ct
- 2635 Blackstock Dr
- 2740 Irwin Ct
- 2635 Newton Ct
- 2720 Blackstock Dr
- 2725 Blackstock Dr