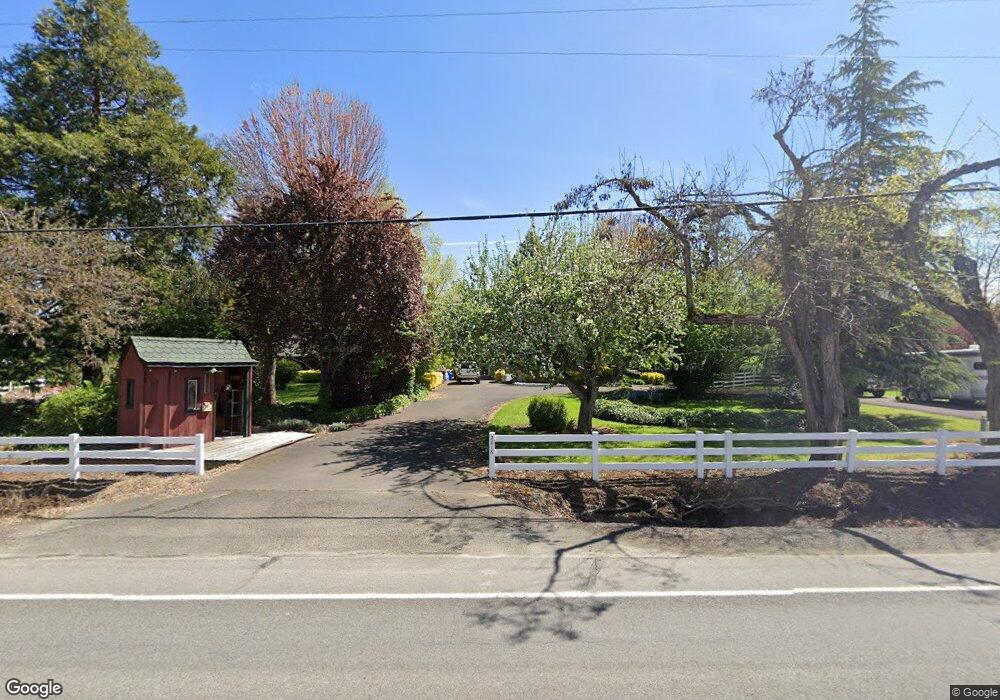
2670 Hanley Rd Central Point, OR 97502
Estimated Value: $681,000 - $816,000
3
Beds
2
Baths
2,144
Sq Ft
$354/Sq Ft
Est. Value
About This Home
This home is located at 2670 Hanley Rd, Central Point, OR 97502 and is currently estimated at $759,927, approximately $354 per square foot. 2670 Hanley Rd is a home located in Jackson County with nearby schools including Richardson Elementary School, Scenic Middle School, and Crater High School.
Ownership History
Date
Name
Owned For
Owner Type
Purchase Details
Closed on
May 23, 2022
Sold by
Flanagan Nancy and Flanagan-Jones Nancy
Bought by
Flanagan-Jones Nancy and Flanagan Nancy
Current Estimated Value
Purchase Details
Closed on
Jun 9, 2014
Sold by
Flanagan Judith
Bought by
Flanagan Nancy
Home Financials for this Owner
Home Financials are based on the most recent Mortgage that was taken out on this home.
Original Mortgage
$4,090
Interest Rate
3.64%
Mortgage Type
Purchase Money Mortgage
Create a Home Valuation Report for This Property
The Home Valuation Report is an in-depth analysis detailing your home's value as well as a comparison with similar homes in the area
Purchase History
| Date | Buyer | Sale Price | Title Company |
|---|---|---|---|
| Flanagan-Jones Nancy | -- | None Listed On Document | |
| Flanagan Nancy | $194,000 | None Available |
Source: Public Records
Mortgage History
| Date | Status | Borrower | Loan Amount |
|---|---|---|---|
| Previous Owner | Flanagan Nancy | $4,090 |
Source: Public Records
Tax History
| Year | Tax Paid | Tax Assessment Tax Assessment Total Assessment is a certain percentage of the fair market value that is determined by local assessors to be the total taxable value of land and additions on the property. | Land | Improvement |
|---|---|---|---|---|
| 2026 | $4,770 | $341,085 | -- | -- |
| 2025 | $4,661 | $379,353 | $112,643 | $266,710 |
| 2024 | $4,661 | $368,312 | $109,362 | $258,950 |
| 2023 | $3,869 | $278,083 | $53,603 | $224,480 |
| 2022 | $3,811 | $308,893 | $61,663 | $247,230 |
| 2021 | $3,704 | $300,015 | $59,975 | $240,040 |
| 2020 | $3,597 | $291,398 | $58,348 | $233,050 |
| 2019 | $3,516 | $274,911 | $55,231 | $219,680 |
| 2018 | $3,409 | $267,021 | $53,741 | $213,280 |
| 2017 | $3,329 | $267,021 | $53,741 | $213,280 |
| 2016 | $3,233 | $251,935 | $50,875 | $201,060 |
| 2015 | $3,085 | $251,935 | $50,875 | $201,060 |
| 2014 | $3,012 | $237,707 | $48,197 | $189,510 |
Source: Public Records
Map
Nearby Homes
- 3200 Hanley Rd
- 3288 Grant Rd
- 895 Holley Way
- 871 Holley Way
- 296 Brandon St
- 3220 Freeland Rd
- 489 Vincent Ave
- 338 Joseph St
- 3307 Freeland Rd
- 1630 Timothy St
- 570 Bachand Cir
- 3371 Freeland Rd
- 2331 Old Stage Rd
- 519 Glenn Way
- 209 Corcoran Ln
- 50 Kathryn Ct
- 436 Cheney Loop
- 887 Silver Fox Dr
- 349 W Pine St
- 185 Logan Ave
Your Personal Tour Guide
Ask me questions while you tour the home.