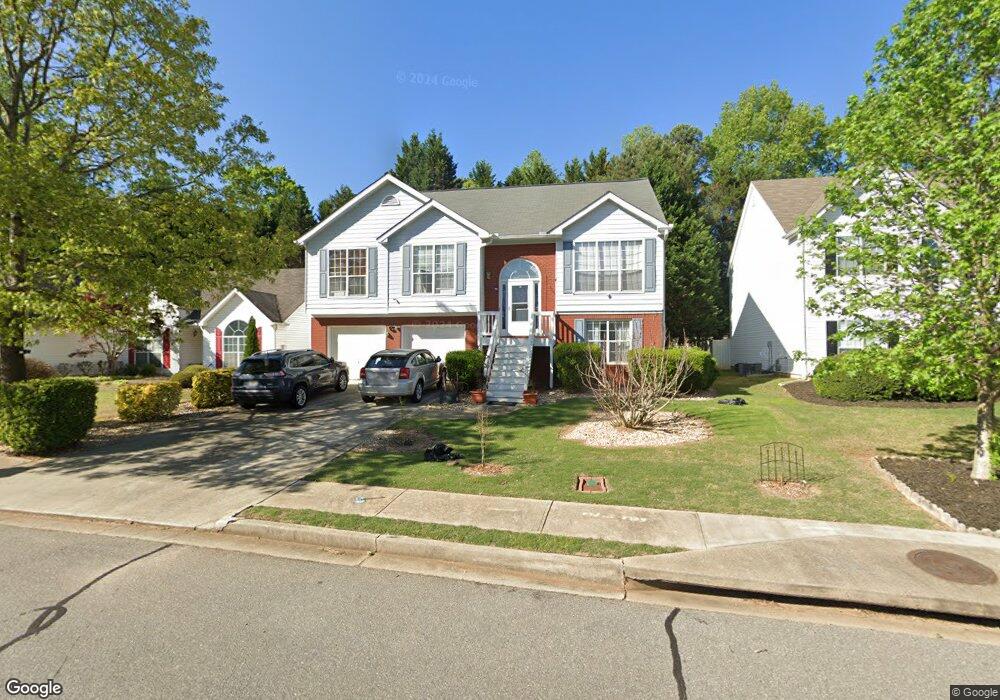
2670 Nesbitt Crossing Way Duluth, GA 30096
Estimated Value: $453,965 - $477,000
4
Beds
3
Baths
2,387
Sq Ft
$194/Sq Ft
Est. Value
About This Home
This home is located at 2670 Nesbitt Crossing Way, Duluth, GA 30096 and is currently estimated at $462,241, approximately $193 per square foot. 2670 Nesbitt Crossing Way is a home located in Gwinnett County with nearby schools including Chattahoochee Elementary School, Coleman Middle School, and Duluth High School.
Ownership History
Date
Name
Owned For
Owner Type
Purchase Details
Closed on
Jun 7, 2007
Sold by
Mohiuddin Saqib
Bought by
Esfandiari Hossein
Current Estimated Value
Home Financials for this Owner
Home Financials are based on the most recent Mortgage that was taken out on this home.
Original Mortgage
$192,780
Outstanding Balance
$116,624
Interest Rate
6.16%
Mortgage Type
New Conventional
Estimated Equity
$345,617
Purchase Details
Closed on
Jun 6, 2005
Sold by
Mohiuddin Saqib
Bought by
Mohiuddin Saqib
Home Financials for this Owner
Home Financials are based on the most recent Mortgage that was taken out on this home.
Original Mortgage
$152,000
Interest Rate
5.37%
Mortgage Type
New Conventional
Purchase Details
Closed on
Jun 6, 1997
Sold by
Castle Homes Inc
Bought by
Schlachter Steven J
Home Financials for this Owner
Home Financials are based on the most recent Mortgage that was taken out on this home.
Original Mortgage
$132,350
Interest Rate
6.75%
Mortgage Type
New Conventional
Create a Home Valuation Report for This Property
The Home Valuation Report is an in-depth analysis detailing your home's value as well as a comparison with similar homes in the area
Home Values in the Area
Average Home Value in this Area
Purchase History
| Date | Buyer | Sale Price | Title Company |
|---|---|---|---|
| Esfandiari Hossein | $214,200 | -- | |
| Mohiuddin Saqib | -- | -- | |
| Mohiuddin Saqib | $190,000 | -- | |
| Schlachter Steven J | $139,400 | -- |
Source: Public Records
Mortgage History
| Date | Status | Borrower | Loan Amount |
|---|---|---|---|
| Open | Esfandiari Hossein | $192,780 | |
| Previous Owner | Mohiuddin Saqib | $152,000 | |
| Previous Owner | Mohiuddin Saqib | $38,000 | |
| Previous Owner | Schlachter Steven J | $132,350 |
Source: Public Records
Tax History
| Year | Tax Paid | Tax Assessment Tax Assessment Total Assessment is a certain percentage of the fair market value that is determined by local assessors to be the total taxable value of land and additions on the property. | Land | Improvement |
|---|---|---|---|---|
| 2025 | $1,041 | $187,520 | $29,920 | $157,600 |
| 2024 | $4,249 | $175,360 | $32,400 | $142,960 |
| 2023 | $4,249 | $115,600 | $20,000 | $95,600 |
| 2022 | $3,032 | $115,600 | $20,000 | $95,600 |
| 2021 | $2,785 | $118,000 | $20,000 | $98,000 |
| 2020 | $3,192 | $118,000 | $20,000 | $98,000 |
| 2019 | $3,813 | $111,080 | $16,000 | $95,080 |
| 2018 | $2,712 | $95,400 | $16,000 | $79,400 |
| 2016 | $2,468 | $84,080 | $16,000 | $68,080 |
| 2015 | $2,654 | $69,120 | $12,400 | $56,720 |
| 2014 | $2,140 | $69,120 | $12,400 | $56,720 |
Source: Public Records
Map
Nearby Homes
- 3592 North St
- 3590 North St
- 3706 Thornbrooke Ct
- 2643 Timberbrooke Place
- 2755 Pine St
- 2988 First St
- 3614 Clearbrooke Way
- 2711 Old Coach Rd
- 3830 Gallant Fox Ct
- 2648 Baxter Pines Way
- 3334 Swallowtail Terrace
- 2717 Kenwood Dr
- 3880 Gallant Fox Ct
- 4734 Dewitt Dr
- 3607 W Lawrenceville St
- 3132 Hill St NW Unit 1
- 4105 Cavalier Way
- 2870 Towne Village Dr NW
- 4220 Cavalier Way
- 2765 Olde Towne Pkwy
- 2680 Nesbitt Crossing Way
- 2660 Nesbitt Crossing Way
- 2650 Nesbitt Crossing Way Unit 1
- 2690 Nesbitt Crossing Way Unit 1
- 2690 Nesbitt Crossing Way
- 2675 Nesbitt Crossing Way Unit 1
- 2655 Nesbitt Crossing Way Unit 1
- 2640 Nesbitt Crossing Way
- 2700 Nesbitt Crossing Way Unit 1
- 2645 Nesbitt Crossing Way Unit 1
- 2735 Nesbitt Crossing Way
- 2710 Nesbitt Crossing Way
- 2630 Nesbitt Crossing Way Unit 1
- 3563 Nesbitt Crossing Cir
- 2635 Nesbitt Crossing Way
- 2745 Nesbitt Crossing Way Unit 1
- 2730 Nesbitt Crossing Way
- 2730 Nesbitt Crossing Way
- 3573 Nesbitt Crossing Cir Unit 1
- 2740 Nesbitt Crossing Way Unit 1
Your Personal Tour Guide
Ask me questions while you tour the home.