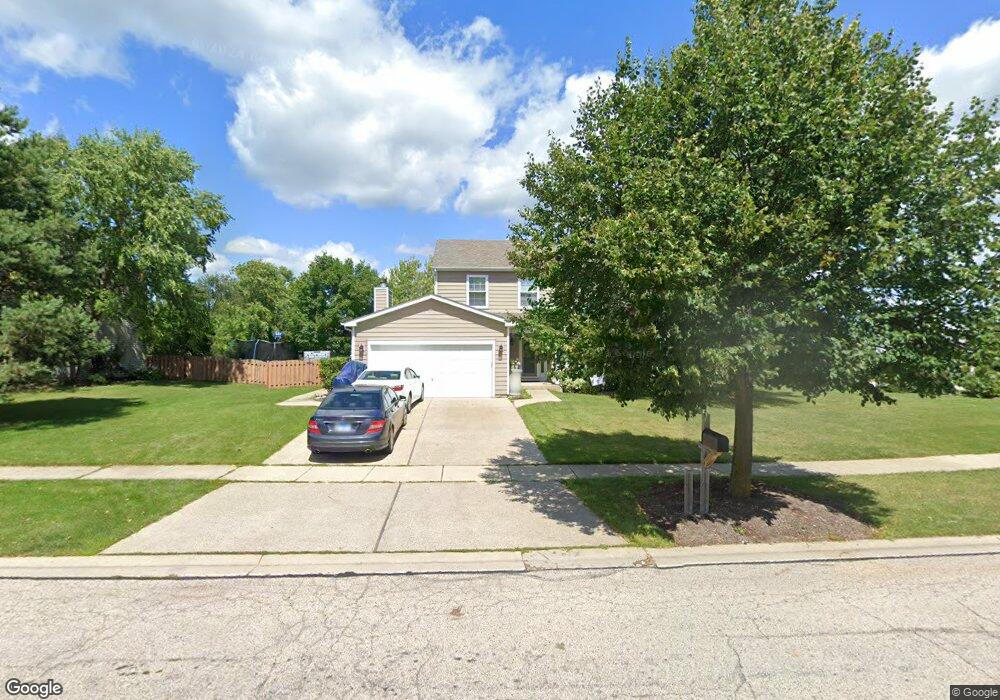
2670 Providence Ln Lindenhurst, IL 60046
Estimated Value: $371,000 - $417,000
3
Beds
3
Baths
2,044
Sq Ft
$198/Sq Ft
Est. Value
About This Home
This home is located at 2670 Providence Ln, Lindenhurst, IL 60046 and is currently estimated at $403,962, approximately $197 per square foot. 2670 Providence Ln is a home located in Lake County with nearby schools including Millburn Elementary School, Millburn Middle School, and Lakes Community High School.
Ownership History
Date
Name
Owned For
Owner Type
Purchase Details
Closed on
Dec 21, 2001
Sold by
Fleischacker Charles and Fleischacker Agatha
Bought by
Heft Matthew B and Heft Cathrine N
Current Estimated Value
Home Financials for this Owner
Home Financials are based on the most recent Mortgage that was taken out on this home.
Original Mortgage
$188,000
Interest Rate
7.14%
Purchase Details
Closed on
Nov 14, 1998
Sold by
Zdrojewski Michael J and Zdrojewski Laurie M
Bought by
Fleischaker Charles and Fleischaker Agatha
Purchase Details
Closed on
Dec 12, 1997
Sold by
The Ryland Group Inc
Bought by
Zdrojewski Michael J and Zdrojewski Laurie M
Home Financials for this Owner
Home Financials are based on the most recent Mortgage that was taken out on this home.
Original Mortgage
$167,800
Interest Rate
6%
Create a Home Valuation Report for This Property
The Home Valuation Report is an in-depth analysis detailing your home's value as well as a comparison with similar homes in the area
Home Values in the Area
Average Home Value in this Area
Purchase History
| Date | Buyer | Sale Price | Title Company |
|---|---|---|---|
| Heft Matthew B | $235,000 | -- | |
| Fleischaker Charles | $189,000 | -- | |
| Zdrojewski Michael J | $186,500 | Ticor Title Insurance Compan |
Source: Public Records
Mortgage History
| Date | Status | Borrower | Loan Amount |
|---|---|---|---|
| Previous Owner | Heft Matthew B | $188,000 | |
| Previous Owner | Zdrojewski Michael J | $167,800 | |
| Closed | Heft Matthew B | $23,500 |
Source: Public Records
Tax History
| Year | Tax Paid | Tax Assessment Tax Assessment Total Assessment is a certain percentage of the fair market value that is determined by local assessors to be the total taxable value of land and additions on the property. | Land | Improvement |
|---|---|---|---|---|
| 2024 | $10,320 | $112,908 | $19,675 | $93,233 |
| 2023 | $10,963 | $99,760 | $17,384 | $82,376 |
| 2022 | $10,963 | $87,189 | $13,161 | $74,028 |
| 2021 | $10,557 | $80,993 | $12,226 | $68,767 |
| 2020 | $10,178 | $78,398 | $11,834 | $66,564 |
| 2019 | $10,906 | $80,127 | $12,095 | $68,032 |
| 2018 | $9,893 | $77,936 | $15,801 | $62,135 |
| 2017 | $9,598 | $75,858 | $15,380 | $60,478 |
| 2016 | $10,698 | $80,873 | $16,397 | $64,476 |
| 2015 | $10,203 | $75,533 | $15,314 | $60,219 |
| 2014 | $10,120 | $68,848 | $15,384 | $53,464 |
| 2012 | $9,062 | $80,960 | $17,751 | $63,209 |
Source: Public Records
Map
Nearby Homes
- 697 Providence Ln
- 2312 High Point Dr
- 19135 W Millburn Rd
- 533 N Beck Rd Unit 28
- 527 Northgate Rd Unit 28
- 1896 E Vista Terrace
- 2208 Sprucewood Ln
- 73 S Beck Rd
- 151 Rose Tree Ln
- 3210 Neubauer Cir
- 804 Neubauer Cir
- 206 Neubauer Cir Unit 1601
- 709 Neubauer Cir
- 1809 Maplewood Ct
- 2711 Neubauer Cir Unit 336
- 20215 W Miller Rd
- 200 S Beck Rd Unit 12
- 210 Hazelwood Dr
- 2002 Burr Oak Ln
- 1650 Natures Way
- 2650 Providence Ln
- 2661 Providence Ln
- 2673 Providence Ln
- 2700 Providence Ln
- 2685 Providence Ln
- 2630 Providence Ln
- 2651 Providence Ln
- 2639 Providence Ln
- 654 Providence Ln
- 2708 Providence Ln
- 2707 Providence Ln
- 659 Windsor Ct
- 660 Providence Ln
- 2629 Providence Ln
- 2672 Delaware Ln
- 2684 Delaware Ln
- 2660 Delaware Ln
- 2710 Delaware Ln
- 2648 Delaware Ln
- 2696 Delaware Ln
Your Personal Tour Guide
Ask me questions while you tour the home.