Estimated Value: $449,623 - $476,000
3
Beds
3
Baths
1,604
Sq Ft
$289/Sq Ft
Est. Value
About This Home
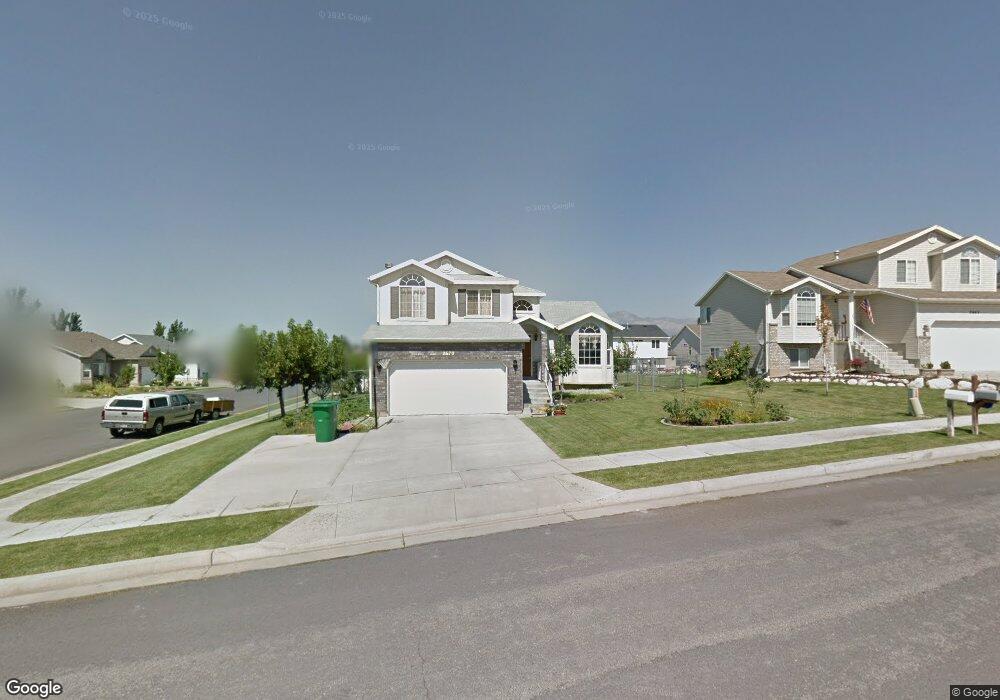
This home is located at 2670 W 4100 S, Roy, UT 84067 and is currently estimated at $463,406, approximately $288 per square foot. 2670 W 4100 S is a home located in Weber County with nearby schools including Midland School, Sand Ridge Junior High School, and Roy High School.
Ownership History
Date
Name
Owned For
Owner Type
Purchase Details
Closed on
May 3, 2000
Sold by
Nilson & Company Inc
Bought by
Sun Sipex and Sun Sideth
Current Estimated Value
Home Financials for this Owner
Home Financials are based on the most recent Mortgage that was taken out on this home.
Original Mortgage
$123,775
Outstanding Balance
$43,099
Interest Rate
8.25%
Estimated Equity
$420,307
Create a Home Valuation Report for This Property
The Home Valuation Report is an in-depth analysis detailing your home's value as well as a comparison with similar homes in the area
Home Values in the Area
Average Home Value in this Area
Purchase History
| Date | Buyer | Sale Price | Title Company |
|---|---|---|---|
| Sun Sipex | -- | Bonneville Title Company |
Source: Public Records
Mortgage History
| Date | Status | Borrower | Loan Amount |
|---|---|---|---|
| Open | Sun Sipex | $123,775 |
Source: Public Records
Tax History
| Year | Tax Paid | Tax Assessment Tax Assessment Total Assessment is a certain percentage of the fair market value that is determined by local assessors to be the total taxable value of land and additions on the property. | Land | Improvement |
|---|---|---|---|---|
| 2025 | $2,806 | $448,152 | $140,308 | $307,844 |
| 2024 | $2,684 | $237,049 | $77,169 | $159,880 |
| 2023 | $2,503 | $220,550 | $72,635 | $147,915 |
| 2022 | $2,843 | $260,700 | $61,766 | $198,934 |
| 2021 | $2,228 | $334,000 | $77,323 | $256,677 |
| 2020 | $2,165 | $299,000 | $77,323 | $221,677 |
| 2019 | $2,149 | $280,000 | $51,830 | $228,170 |
| 2018 | $1,988 | $243,000 | $46,848 | $196,152 |
| 2017 | $1,839 | $210,000 | $44,899 | $165,101 |
| 2016 | $1,766 | $108,362 | $25,468 | $82,894 |
| 2015 | $1,589 | $99,318 | $25,468 | $73,850 |
| 2014 | $1,536 | $94,642 | $22,658 | $71,984 |
Source: Public Records
Map
Nearby Homes
- 2778 W 4175 S Unit 237
- 4297 Westlake Dr
- 3860 S Midland Dr Unit B 51
- 2815 W 4275 S
- 4270 S 2900 W
- 4248 S 2400 W
- 4374 S 2900 W
- 3750 S Midland Dr Unit 80
- 3750 S Midland Dr Unit 189
- 3750 S Midland Dr
- 3750 S Midland Dr Unit 34
- 3750 Midland Dr
- 3750 Midland Dr Unit 169
- 2979 W 4275 S
- 3860 Midland Dr Unit C10
- 3860 Midland Dr Unit C39
- 3860 Midland Dr Unit A18
- 3860 Midland Dr Unit B32
- 3860 Midland Dr Unit C62
- 4061 S 2175 W
Your Personal Tour Guide
Ask me questions while you tour the home.