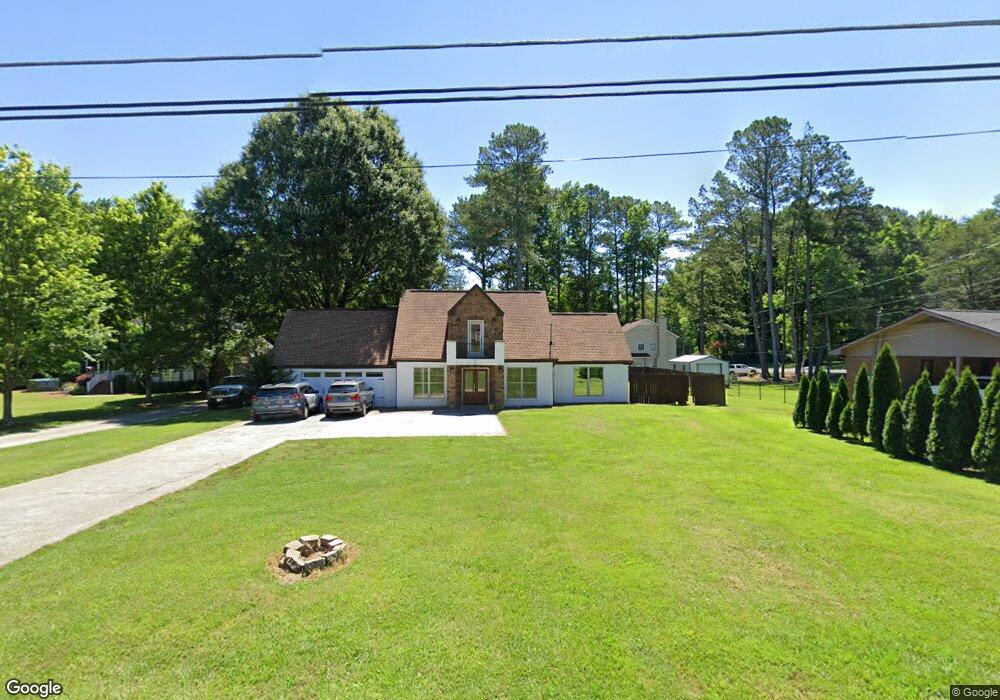
2671 Dug Gap Rd Dalton, GA 30720
Estimated Value: $280,000 - $319,000
--
Bed
3
Baths
1,863
Sq Ft
$164/Sq Ft
Est. Value
About This Home
This home is located at 2671 Dug Gap Rd, Dalton, GA 30720 and is currently estimated at $305,217, approximately $163 per square foot. 2671 Dug Gap Rd is a home located in Whitfield County with nearby schools including Dug Gap Elementary School, Valley Point Middle School, and Southeast Whitfield County High School.
Ownership History
Date
Name
Owned For
Owner Type
Purchase Details
Closed on
Sep 14, 2015
Sold by
Warfield Rebecca
Bought by
Calandria Roberto Gonzalo and Flores Nelly
Current Estimated Value
Home Financials for this Owner
Home Financials are based on the most recent Mortgage that was taken out on this home.
Original Mortgage
$118,000
Outstanding Balance
$92,871
Interest Rate
3.97%
Mortgage Type
New Conventional
Estimated Equity
$212,346
Purchase Details
Closed on
Jan 31, 2012
Sold by
Stone Rodney B
Bought by
Warfield Rebecca S
Purchase Details
Closed on
May 1, 1994
Bought by
Stone Rodney B and Stone Marsha I
Create a Home Valuation Report for This Property
The Home Valuation Report is an in-depth analysis detailing your home's value as well as a comparison with similar homes in the area
Home Values in the Area
Average Home Value in this Area
Purchase History
| Date | Buyer | Sale Price | Title Company |
|---|---|---|---|
| Calandria Roberto Gonzalo | $128,000 | -- | |
| Warfield Rebecca S | $116,000 | -- | |
| Stone Rodney B | $110,000 | -- |
Source: Public Records
Mortgage History
| Date | Status | Borrower | Loan Amount |
|---|---|---|---|
| Open | Calandria Roberto Gonzalo | $118,000 |
Source: Public Records
Tax History Compared to Growth
Tax History
| Year | Tax Paid | Tax Assessment Tax Assessment Total Assessment is a certain percentage of the fair market value that is determined by local assessors to be the total taxable value of land and additions on the property. | Land | Improvement |
|---|---|---|---|---|
| 2024 | $1,757 | $112,228 | $8,400 | $103,828 |
| 2023 | $1,757 | $65,566 | $6,000 | $59,566 |
| 2022 | $1,399 | $55,992 | $6,000 | $49,992 |
| 2021 | $1,400 | $55,992 | $6,000 | $49,992 |
| 2020 | $1,436 | $55,992 | $6,000 | $49,992 |
| 2019 | $1,379 | $53,596 | $6,000 | $47,596 |
| 2018 | $1,396 | $53,596 | $6,000 | $47,596 |
| 2017 | $1,397 | $53,596 | $6,000 | $47,596 |
| 2016 | $1,235 | $49,614 | $6,300 | $43,314 |
| 2014 | $1,137 | $49,614 | $6,300 | $43,314 |
| 2013 | -- | $49,614 | $6,300 | $43,314 |
Source: Public Records
Map
Nearby Homes
- 1108 Sunset Dr SW
- 2606 Foxmore Cir
- 2654 Foxmore Cir
- 0 N Dug Gap Rd Unit 20254832
- 0 N Dug Gap Rd Unit RTC3015177
- 0 N Dug Gap Rd Unit 131142
- 103 Southwind Terrace
- 2512 Dug Gap Rd
- 315 Summit Cir SW
- 512 Dalewood Dr
- 506 Lavista Rd
- 000 S Dixie Hwy
- 150 Forest Hill Rd SW
- 0 S Dixie Hwy Unit 131308
- 00 S Dixie Hwy
- 171 Maurine Dr
- 169 Waterfront Way
- 139 Waterfront Way
- 107 Hill Cir
- 107 Green Rd
- 2671 Dug Gap Rd
- 2677 Dug Gap Rd
- 2667 Dug Gap Rd
- 2689 Dug Gap Rd
- 1106 Sunset Dr SW
- 1107 Sunset Dr SW
- 2666 Dug Gap Rd
- 2691 Dug Gap Rd
- 1104 Sunset Dr SW
- 1105 Sunset Dr SW
- 2686 Dug Gap Rd
- 2653 Dug Gap Rd
- 2690 Dug Gap Rd
- 1102 Sunset Dr SW
- 1103 Sunset Dr SW
- 2654 Dug Gap Rd
- 2657 Dug Gap Rd
- 2694 Dug Gap Rd
- 1100 Sunset Dr SW
- 106 Creekside Dr