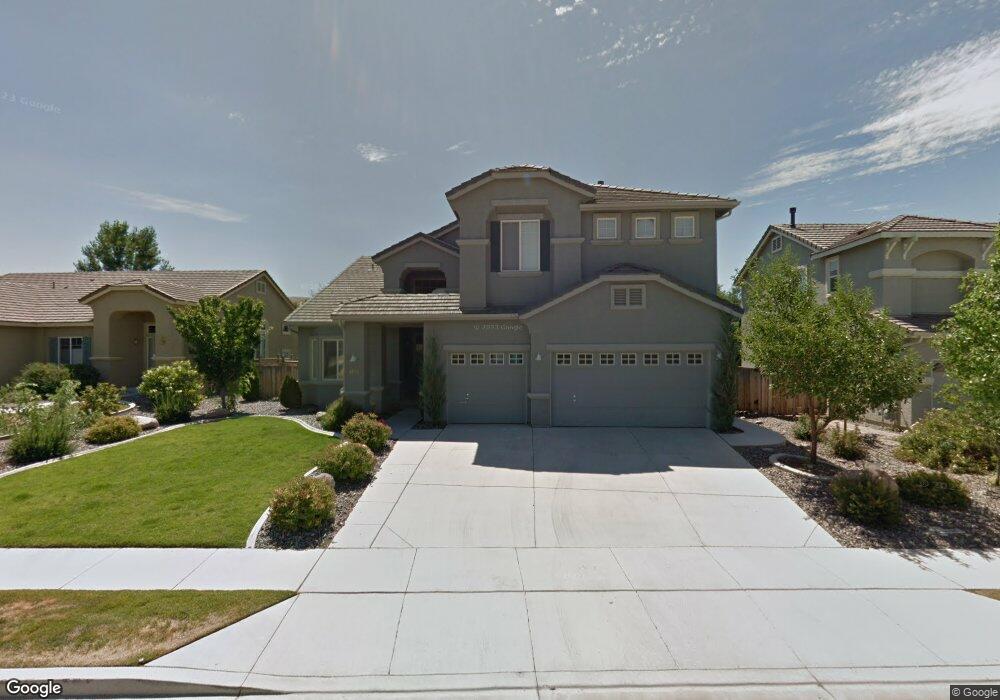
2671 Sutter Butte Ct Sparks, NV 89436
Wingfield Springs NeighborhoodEstimated Value: $719,292 - $848,000
5
Beds
3
Baths
3,290
Sq Ft
$230/Sq Ft
Est. Value
About This Home
This home is located at 2671 Sutter Butte Ct, Sparks, NV 89436 and is currently estimated at $758,073, approximately $230 per square foot. 2671 Sutter Butte Ct is a home located in Washoe County with nearby schools including Van Gorder Elementary School, Sky Ranch Middle School, and Spanish Springs High School.
Ownership History
Date
Name
Owned For
Owner Type
Purchase Details
Closed on
Jun 8, 2006
Sold by
Price John Anthony and Price Cheryl Lee
Bought by
Kruse Darren Paul and Kruse Deborah Joan
Current Estimated Value
Home Financials for this Owner
Home Financials are based on the most recent Mortgage that was taken out on this home.
Original Mortgage
$180,000
Outstanding Balance
$105,766
Interest Rate
6.56%
Mortgage Type
Unknown
Estimated Equity
$652,307
Purchase Details
Closed on
Jun 4, 2002
Sold by
Silverado 140 Lp
Bought by
Price John Anthony and Price Cheryl Lee
Home Financials for this Owner
Home Financials are based on the most recent Mortgage that was taken out on this home.
Original Mortgage
$241,996
Interest Rate
6.74%
Create a Home Valuation Report for This Property
The Home Valuation Report is an in-depth analysis detailing your home's value as well as a comparison with similar homes in the area
Home Values in the Area
Average Home Value in this Area
Purchase History
| Date | Buyer | Sale Price | Title Company |
|---|---|---|---|
| Kruse Darren Paul | $525,000 | Stewart Title Of Northern Nv | |
| Price John Anthony | $302,495 | First American Title |
Source: Public Records
Mortgage History
| Date | Status | Borrower | Loan Amount |
|---|---|---|---|
| Open | Kruse Darren Paul | $180,000 | |
| Previous Owner | Price John Anthony | $241,996 | |
| Closed | Price John Anthony | $15,000 |
Source: Public Records
Tax History Compared to Growth
Tax History
| Year | Tax Paid | Tax Assessment Tax Assessment Total Assessment is a certain percentage of the fair market value that is determined by local assessors to be the total taxable value of land and additions on the property. | Land | Improvement |
|---|---|---|---|---|
| 2025 | $3,933 | $187,523 | $46,375 | $141,148 |
| 2024 | $3,820 | $180,818 | $38,290 | $142,528 |
| 2023 | $3,820 | $173,768 | $38,850 | $134,918 |
| 2022 | $3,709 | $143,879 | $32,060 | $111,819 |
| 2021 | $3,601 | $139,791 | $28,350 | $111,441 |
| 2020 | $3,495 | $141,143 | $29,470 | $111,673 |
| 2019 | $3,394 | $136,390 | $27,615 | $108,775 |
| 2018 | $3,295 | $126,038 | $19,845 | $106,193 |
| 2017 | $3,201 | $124,961 | $18,655 | $106,306 |
| 2016 | $3,117 | $123,538 | $17,675 | $105,863 |
| 2015 | $3,112 | $110,716 | $15,400 | $95,316 |
| 2014 | $3,021 | $96,744 | $13,195 | $83,549 |
| 2013 | -- | $79,112 | $10,710 | $68,402 |
Source: Public Records
Map
Nearby Homes
- 2691 Sutter Butte Ct
- 7302 Little Easy St
- 7330 Little Easy St
- 2880 Friar Rock Ct
- 2861 Friar Rock Ct
- 2880 Thistle Belle Ct
- 2850 Friar Rock Ct
- 7105 High Hill St
- 2457 Newberry Ct Unit Oakhill 102
- 2850 Billie Dove Ct
- 2535 Demaris St
- 7430 Earlsmoore Dr
- 7420 Island Queen Dr
- 7476 Lorna Ln
- 2386 Newberry Way
- 7050 Island Queen Ct Unit 16
- 6831 Island Queen Ct Unit 16
- 2376 Newberry Way
- 2617 Bridgetown Loop
- 2608 Arrow Smith Dr Unit 13B
- 2681 Sutter Butte Ct
- 2661 Sutter Butte Ct
- 712 Little Easy St
- 2672 Pride Dr
- 2662 Pride Dr
- 2651 Sutter Butte Ct
- 2682 Pride Dr
- 2652 Pride Dr
- 2672 Sutter Butte Ct
- 2662 Sutter Butte Ct
- 2696 Pride Dr
- 2682 Sutter Butte Ct
- 2652 Sutter Butte Ct
- 7302 La Costa St
- 7381 Ash Peak Dr
- 7401 Ash Peak Dr
- 7430 Baysheen Ct
- 7426 Baysheen Ct
- 7282 Little Easy St
- 7371 Ash Peak Dr