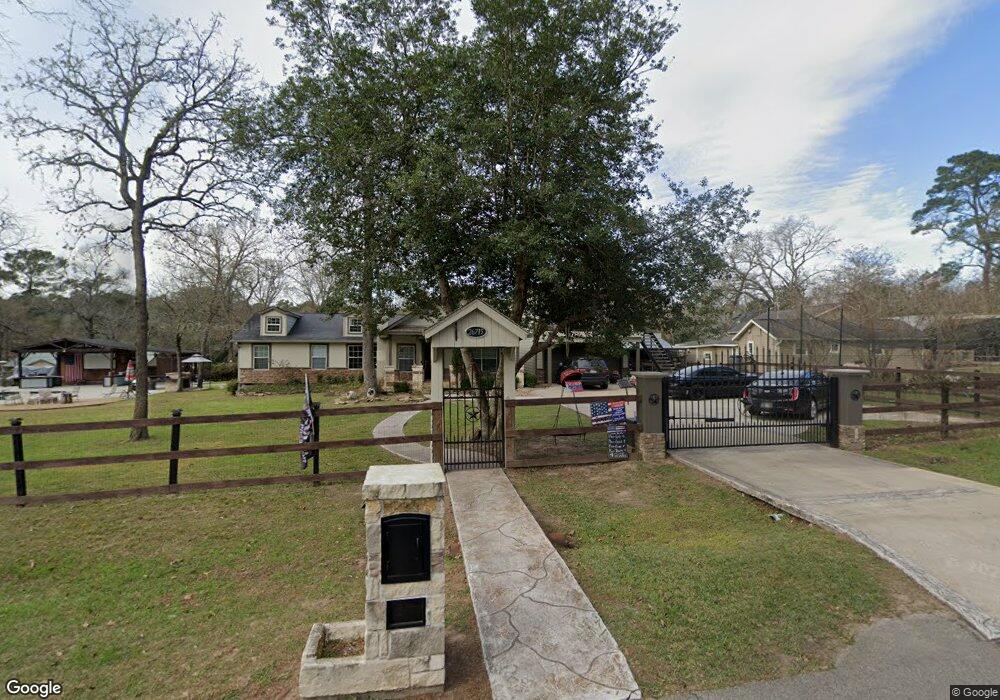
26715 N Barnett St Magnolia, TX 77355
Estimated Value: $227,000 - $275,000
--
Bed
2
Baths
1,607
Sq Ft
$157/Sq Ft
Est. Value
About This Home
This home is located at 26715 N Barnett St, Magnolia, TX 77355 and is currently estimated at $252,879, approximately $157 per square foot. 26715 N Barnett St is a home located in Montgomery County with nearby schools including Nichols Sawmill Elementary School, Magnolia Sixth Grade Campus, and Magnolia Junior High School.
Ownership History
Date
Name
Owned For
Owner Type
Purchase Details
Closed on
Aug 22, 2008
Sold by
Bridge Investments Lp
Bought by
Hcu Construction Llc
Current Estimated Value
Home Financials for this Owner
Home Financials are based on the most recent Mortgage that was taken out on this home.
Original Mortgage
$28,400
Interest Rate
6.66%
Mortgage Type
Seller Take Back
Purchase Details
Closed on
Jun 9, 2008
Sold by
Builders Training Sales & Mktg Group Inc
Bought by
Bridge Investments Lp
Purchase Details
Closed on
Aug 2, 2007
Sold by
Conover Sheri and Conover Mark
Bought by
Builders Training Sales Mktg Group Inc
Home Financials for this Owner
Home Financials are based on the most recent Mortgage that was taken out on this home.
Original Mortgage
$73,500
Interest Rate
6.69%
Mortgage Type
Purchase Money Mortgage
Purchase Details
Closed on
Jul 26, 2007
Sold by
Conover Robert
Bought by
Conover Sheri
Home Financials for this Owner
Home Financials are based on the most recent Mortgage that was taken out on this home.
Original Mortgage
$73,500
Interest Rate
6.69%
Mortgage Type
Purchase Money Mortgage
Create a Home Valuation Report for This Property
The Home Valuation Report is an in-depth analysis detailing your home's value as well as a comparison with similar homes in the area
Home Values in the Area
Average Home Value in this Area
Purchase History
| Date | Buyer | Sale Price | Title Company |
|---|---|---|---|
| Hcu Construction Llc | -- | Fidelity National Title | |
| Bridge Investments Lp | $33,000 | None Available | |
| Builders Training Sales Mktg Group Inc | -- | Chicago Title | |
| Conover Sheri | -- | None Available |
Source: Public Records
Mortgage History
| Date | Status | Borrower | Loan Amount |
|---|---|---|---|
| Closed | Hcu Construction Llc | $28,400 | |
| Previous Owner | Builders Training Sales Mktg Group Inc | $73,500 |
Source: Public Records
Tax History Compared to Growth
Tax History
| Year | Tax Paid | Tax Assessment Tax Assessment Total Assessment is a certain percentage of the fair market value that is determined by local assessors to be the total taxable value of land and additions on the property. | Land | Improvement |
|---|---|---|---|---|
| 2025 | $2,947 | $173,910 | $118,400 | $55,510 |
| 2024 | $2,893 | $186,157 | $118,400 | $67,757 |
| 2023 | $2,893 | $183,270 | $118,400 | $64,870 |
| 2022 | $2,930 | $166,060 | $118,400 | $47,660 |
| 2021 | $1,571 | $84,540 | $29,600 | $54,940 |
| 2020 | $1,659 | $81,980 | $29,600 | $52,380 |
| 2019 | $1,187 | $58,920 | $29,600 | $29,320 |
| 2018 | $934 | $44,170 | $18,940 | $25,230 |
| 2017 | $1,071 | $50,500 | $18,940 | $31,560 |
| 2016 | $889 | $41,920 | $10,360 | $31,560 |
| 2015 | $661 | $41,920 | $10,360 | $31,560 |
| 2014 | $661 | $30,820 | $10,360 | $20,460 |
Source: Public Records
Map
Nearby Homes
- 21242 Natalia Grove
- 26603 N Marek Ln
- 27011 Sunset Dr
- 27114 N Heaton Ln
- 24754 Majestic Cone Ln
- 17910 Sea Turtle Ct
- 26523 S Carrol Ln
- 17503 Heaton Ct
- 26530 S Dogwood Ln
- 27119 Seahorse Ln
- 17819 Indigo Hills Dr
- 17103 Indigo Hills Dr
- 21610 Meadowsweet Dr
- 27141 Nichols Sawmill Rd
- 17447 Country Skies
- 26115 Country Woods Trail
- 26718 Stagecoach Crossing Dr
- 00000 Butera Rd
- 16910 Butera Rd
- 22102 Badger Hollow Dr
- 26807 N Barnett St
- 26718 Sunset Ln
- 26811 N Barnett St
- 26806 Sunset Ln
- 26718 N Barnett Ln
- 26714 N Barnett St
- 26711 N Barnett St
- 26714 Sunset Ln
- 26734 N Barnett Ln
- 24618 Sapling Pine St
- 24666 Sapling Pine St
- 24634 Sapling Pine St
- 24630 Sapling Pine St
- 24622 Sapling Pine St
- 24662 Sapling Pine St
- 24610 Sapling Pine St
- 24626 Sapling Pine St
- 24654 Sapling Pine St
- 24638 Sapling Pine St
- 16916 Conifer Cone Ln