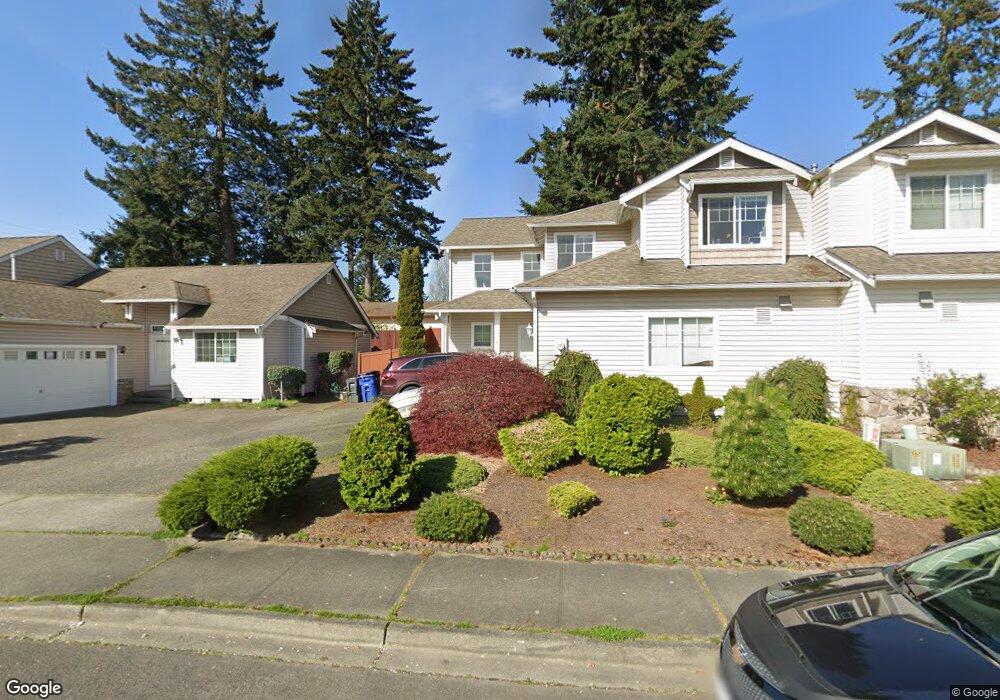
26719 19th Ave S Des Moines, WA 98198
Woodmont NeighborhoodEstimated Value: $551,000 - $637,449
3
Beds
3
Baths
2,060
Sq Ft
$284/Sq Ft
Est. Value
About This Home
This home is located at 26719 19th Ave S, Des Moines, WA 98198 and is currently estimated at $585,612, approximately $284 per square foot. 26719 19th Ave S is a home located in King County with nearby schools including Woodmont K-8 School, Sacajawea Middle School, and Federal Way High School.
Ownership History
Date
Name
Owned For
Owner Type
Purchase Details
Closed on
Jul 27, 2004
Sold by
Afford A Home Inc
Bought by
Campbell Erik and Campbell Bao Ngoc
Current Estimated Value
Home Financials for this Owner
Home Financials are based on the most recent Mortgage that was taken out on this home.
Original Mortgage
$225,760
Outstanding Balance
$114,100
Interest Rate
6.29%
Mortgage Type
FHA
Estimated Equity
$471,512
Purchase Details
Closed on
Jun 23, 2000
Sold by
Diesen Charles F and Diesen Lorna K
Bought by
Frazer Post Office Llc
Purchase Details
Closed on
Nov 25, 1998
Sold by
Dunlap Douglas A and Fykerud Charlotte C
Bought by
Diesen Charles F and Diesen Lorna K
Purchase Details
Closed on
Mar 29, 1995
Sold by
Brown Zane A and Brown Cecelia G
Bought by
Diesen Charles F and Diesen Lorna K
Create a Home Valuation Report for This Property
The Home Valuation Report is an in-depth analysis detailing your home's value as well as a comparison with similar homes in the area
Home Values in the Area
Average Home Value in this Area
Purchase History
| Date | Buyer | Sale Price | Title Company |
|---|---|---|---|
| Campbell Erik | $228,950 | Transnation Ti | |
| Frazer Post Office Llc | -- | Transnation Title Insurance | |
| Diesen Charles F | -- | Transnation Title Insurance | |
| Diesen Charles F | $85,000 | Transamerica Title Insurance |
Source: Public Records
Mortgage History
| Date | Status | Borrower | Loan Amount |
|---|---|---|---|
| Open | Campbell Erik | $225,760 |
Source: Public Records
Tax History Compared to Growth
Tax History
| Year | Tax Paid | Tax Assessment Tax Assessment Total Assessment is a certain percentage of the fair market value that is determined by local assessors to be the total taxable value of land and additions on the property. | Land | Improvement |
|---|---|---|---|---|
| 2024 | $6,048 | $566,000 | $152,000 | $414,000 |
| 2023 | $5,271 | $508,000 | $137,000 | $371,000 |
| 2022 | $4,842 | $505,000 | $132,000 | $373,000 |
| 2021 | $4,528 | $404,000 | $108,000 | $296,000 |
| 2020 | $4,350 | $354,000 | $94,000 | $260,000 |
| 2018 | $4,893 | $326,000 | $80,000 | $246,000 |
| 2017 | $4,075 | $323,000 | $77,000 | $246,000 |
| 2016 | $4,258 | $266,000 | $70,000 | $196,000 |
| 2015 | -- | $266,000 | $65,000 | $201,000 |
| 2014 | -- | $248,000 | $62,000 | $186,000 |
| 2013 | -- | $193,000 | $57,000 | $136,000 |
Source: Public Records
Map
Nearby Homes
- 26630 19th Ave S
- 26505 Pacific Hwy S
- 1302 S S 268th St
- 26820 16th Ave S
- 1645 S 272nd St Unit 13
- 1645 S 272nd St Unit 33
- 26224 14th Place S
- 25916 18th Ave S
- 2609 S 272nd St Unit 33
- 2609 S 272nd St Unit 36
- 1052 S 264th St
- 2613 S 272nd St Unit 21
- 1217 S 273rd Place
- 1429 S 259th St
- 25918 14th Ave S
- 27526 26th Ave S
- 26917 30th Place S Unit 13
- 26913 30th Place S Unit 11
- 26831 30th Place S Unit 7
- 26919 30th Place S Unit 14
- 26721 19th Ave S
- 26717 19th Ave S
- 26650 18th Place S
- 26723 19th Ave S
- 26638 18th Place S
- 26715 19th Ave S
- 26718 19th Ave S
- 26660 18th Place S
- 26716 19th Ave S
- 26720 19th Ave S
- 26713 19th Ave S
- 26630 18th Place S
- 26714 19th Ave S
- 26722 19th Ave S
- 26711 19th Ave S
- 26712 19th Ave S
- 26628 19th Ave S
- 26622 18th Place S
- 26626 19th Ave S
- 26624 19th Ave S