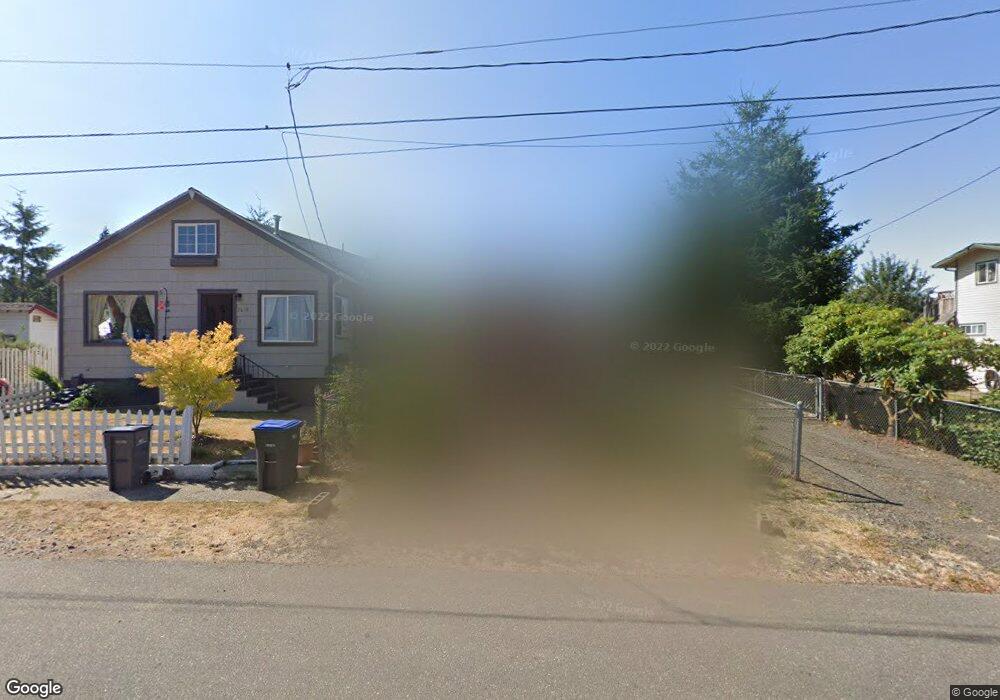
2672 E 1st St Port Orchard, WA 98366
Estimated Value: $319,000 - $344,000
1
Bed
2
Baths
720
Sq Ft
$464/Sq Ft
Est. Value
About This Home
This home is located at 2672 E 1st St, Port Orchard, WA 98366 and is currently estimated at $334,055, approximately $463 per square foot. 2672 E 1st St is a home located in Kitsap County with nearby schools including East Port Orchard Elementary School, Marcus Whitman Middle School, and South Kitsap High School.
Ownership History
Date
Name
Owned For
Owner Type
Purchase Details
Closed on
Jul 17, 2017
Sold by
Spevak William
Bought by
Fordyee Debra Mae
Current Estimated Value
Home Financials for this Owner
Home Financials are based on the most recent Mortgage that was taken out on this home.
Original Mortgage
$181,818
Outstanding Balance
$151,102
Interest Rate
3.9%
Mortgage Type
New Conventional
Estimated Equity
$182,953
Purchase Details
Closed on
Jan 9, 2006
Sold by
Wolfsen Mary
Bought by
Spevak William
Home Financials for this Owner
Home Financials are based on the most recent Mortgage that was taken out on this home.
Original Mortgage
$23,800
Interest Rate
6.32%
Mortgage Type
Stand Alone Second
Purchase Details
Closed on
Sep 29, 1995
Sold by
Gudmunson Keith R
Bought by
Gudmunson Mary L
Create a Home Valuation Report for This Property
The Home Valuation Report is an in-depth analysis detailing your home's value as well as a comparison with similar homes in the area
Home Values in the Area
Average Home Value in this Area
Purchase History
| Date | Buyer | Sale Price | Title Company |
|---|---|---|---|
| Fordyee Debra Mae | $180,000 | Pacific Northwest Title | |
| Spevak William | $119,280 | Transnation Title Ins Co | |
| Gudmunson Mary L | -- | Security Union Title Ins Co |
Source: Public Records
Mortgage History
| Date | Status | Borrower | Loan Amount |
|---|---|---|---|
| Open | Fordyee Debra Mae | $181,818 | |
| Previous Owner | Spevak William | $23,800 | |
| Previous Owner | Spevak William | $95,200 |
Source: Public Records
Tax History Compared to Growth
Tax History
| Year | Tax Paid | Tax Assessment Tax Assessment Total Assessment is a certain percentage of the fair market value that is determined by local assessors to be the total taxable value of land and additions on the property. | Land | Improvement |
|---|---|---|---|---|
| 2026 | $2,193 | $252,800 | $57,110 | $195,690 |
| 2025 | $2,193 | $242,190 | $55,490 | $186,700 |
| 2024 | $2,128 | $242,190 | $55,490 | $186,700 |
| 2023 | $2,113 | $242,190 | $55,490 | $186,700 |
| 2022 | $2,108 | $202,820 | $51,820 | $151,000 |
| 2021 | $1,664 | $149,710 | $48,150 | $101,560 |
| 2020 | $1,639 | $143,410 | $45,860 | $97,550 |
| 2019 | $1,262 | $119,370 | $45,030 | $74,340 |
| 2018 | $1,278 | $96,900 | $45,030 | $51,870 |
| 2017 | $1,128 | $96,900 | $45,030 | $51,870 |
| 2016 | $1,142 | $90,210 | $45,030 | $45,180 |
| 2015 | $1,113 | $89,150 | $45,030 | $44,120 |
| 2014 | -- | $88,100 | $45,030 | $43,070 |
| 2013 | -- | $88,870 | $47,390 | $41,480 |
Source: Public Records
Map
Nearby Homes
- 123 E 4th St
- 343 Farragut Ave N
- 22 Lots E Washington St
- 0 E Washington St Unit NWM2337936
- 0 Beach Dr E Unit NWM2448019
- 0 Beach Dr E Unit NWM2139946
- 3140 E Washington St
- 1811 Bay St
- 130 Mitchell Ave
- 2949 SE Mile Hill Dr Unit C-2
- 190 SE Mile Hill Dr
- 4990 Mile Hill Dr
- 204 Rockwell Ave
- 0 XXX Bay St
- 3817 SE Horstman Rd
- 1341 Salt Point Place E
- 0 Wendell Ave SE
- 4 SE Sinclair View Dr
- 3589 SE Pine Tree Dr
- 4233 SE Horsehead Way