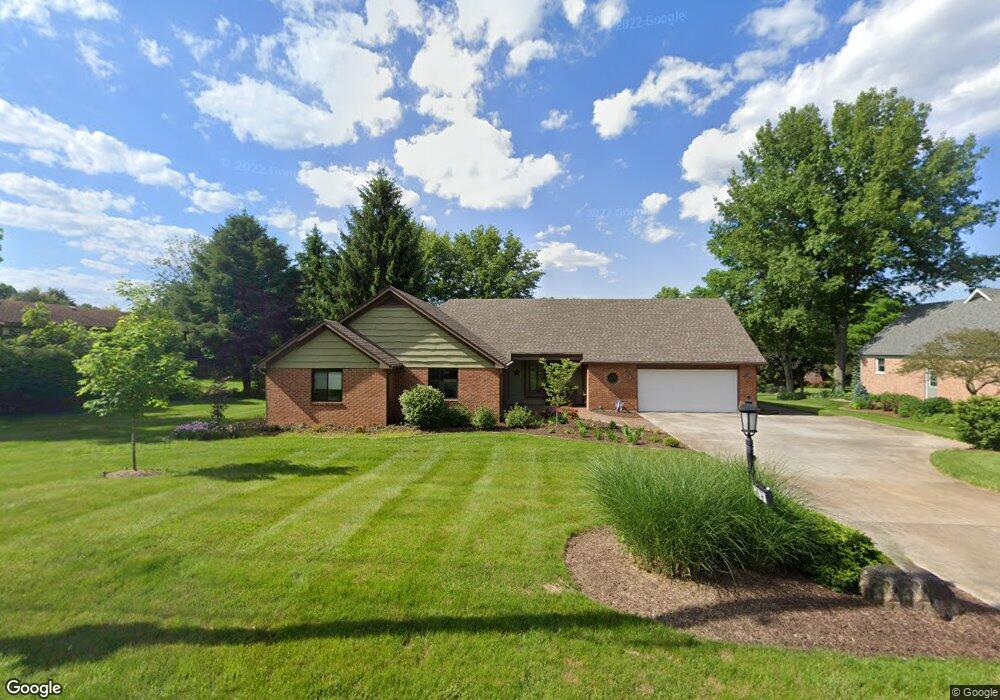
2672 Lantz Rd Beavercreek, OH 45434
Estimated Value: $319,000 - $350,000
3
Beds
2
Baths
2,060
Sq Ft
$162/Sq Ft
Est. Value
About This Home
This home is located at 2672 Lantz Rd, Beavercreek, OH 45434 and is currently estimated at $334,278, approximately $162 per square foot. 2672 Lantz Rd is a home located in Greene County with nearby schools including Main Elementary School, Jacob Coy Middle School, and Beavercreek High School.
Ownership History
Date
Name
Owned For
Owner Type
Purchase Details
Closed on
Nov 30, 2005
Sold by
Stys Lori R and Stys Robert A
Bought by
Tompkins Lynda D
Current Estimated Value
Home Financials for this Owner
Home Financials are based on the most recent Mortgage that was taken out on this home.
Original Mortgage
$214,500
Outstanding Balance
$120,797
Interest Rate
6.4%
Mortgage Type
Unknown
Estimated Equity
$213,481
Purchase Details
Closed on
Jul 16, 2001
Sold by
Theodoras James T and Theodoras Duffy M
Bought by
Bury Lori R
Home Financials for this Owner
Home Financials are based on the most recent Mortgage that was taken out on this home.
Original Mortgage
$141,200
Interest Rate
7.16%
Purchase Details
Closed on
Jul 11, 1995
Sold by
Lowe Howard
Bought by
Arthur Richard P and Arthur S
Home Financials for this Owner
Home Financials are based on the most recent Mortgage that was taken out on this home.
Original Mortgage
$17,625
Interest Rate
7.9%
Mortgage Type
New Conventional
Create a Home Valuation Report for This Property
The Home Valuation Report is an in-depth analysis detailing your home's value as well as a comparison with similar homes in the area
Home Values in the Area
Average Home Value in this Area
Purchase History
| Date | Buyer | Sale Price | Title Company |
|---|---|---|---|
| Tompkins Lynda D | $214,500 | None Available | |
| Bury Lori R | $185,400 | -- | |
| Arthur Richard P | $185,500 | -- |
Source: Public Records
Mortgage History
| Date | Status | Borrower | Loan Amount |
|---|---|---|---|
| Open | Tompkins Lynda D | $214,500 | |
| Previous Owner | Bury Lori R | $141,200 | |
| Previous Owner | Arthur Richard P | $17,625 |
Source: Public Records
Tax History
| Year | Tax Paid | Tax Assessment Tax Assessment Total Assessment is a certain percentage of the fair market value that is determined by local assessors to be the total taxable value of land and additions on the property. | Land | Improvement |
|---|---|---|---|---|
| 2024 | $6,421 | $97,400 | $16,620 | $80,780 |
| 2023 | $6,360 | $97,400 | $16,620 | $80,780 |
| 2022 | $5,548 | $75,010 | $11,870 | $63,140 |
| 2021 | $5,435 | $75,010 | $11,870 | $63,140 |
| 2020 | $5,476 | $75,010 | $11,870 | $63,140 |
| 2019 | $4,774 | $59,690 | $10,820 | $48,870 |
| 2018 | $4,213 | $59,690 | $10,820 | $48,870 |
| 2017 | $4,352 | $59,690 | $10,820 | $48,870 |
| 2016 | $4,352 | $59,730 | $10,820 | $48,910 |
| 2015 | $4,327 | $59,730 | $10,820 | $48,910 |
| 2014 | $4,261 | $59,730 | $10,820 | $48,910 |
Source: Public Records
Map
Nearby Homes
- 2925 Lantz Rd
- 1382 Fudge Dr
- 1745 Maple Ln
- 1326 LeMcKe Rd
- 1532 Hanes Rd
- 3009 Highlander Dr
- 2847 Greenridge Cir
- 2331 Eastwind Dr
- 1520 Hillside Dr
- 2082 Tamarack Ridge Ct
- 1631 Etta Kable Dr
- 2118 van Oss Dr
- 2721 Terraceview Cir
- 3080 Village Green Dr Unit 3090
- 1140 Fudge Dr
- 2235 Tourney Trail
- 1565 N Fairfield Rd
- 1260 Camden Trace
- 1575 N Fairfield Rd
- 2108 William Tanner Rd
- 2662 Lantz Rd
- 2682 Lantz Rd
- 2661 Pheasant Run Ln
- 2652 Lantz Rd
- 2694 Lantz Rd
- 1665 Shoreham Dr
- 2681 Pheasant Run Ln
- 2667 Lantz Rd
- 2 Lantz Rd Unit A
- 2677 Lantz Rd
- 1655 Shoreham Dr
- 2704 Lantz Rd
- 2687 Lantz Rd
- 2642 Lantz Rd
- 2645 Pheasant Run Ln
- 2657 Lantz Rd
- 1645 Shoreham Dr
- 2697 Lantz Rd
- 2633 Lantz Rd
- 2714 Lantz Rd
Your Personal Tour Guide
Ask me questions while you tour the home.