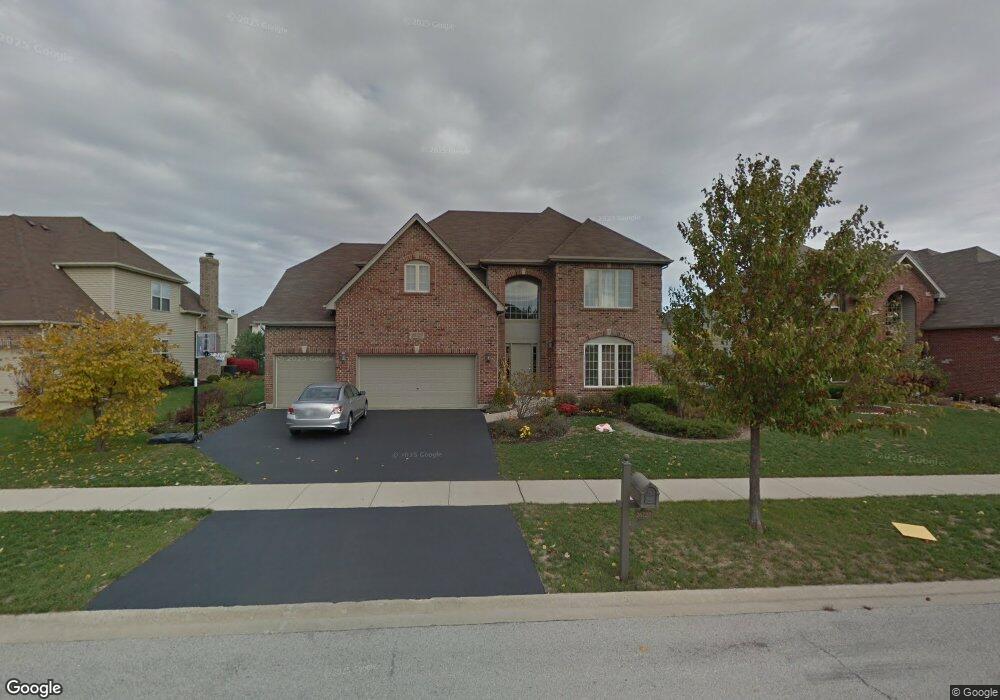
26727 Lindengate Cir Plainfield, IL 60585
Grande Park NeighborhoodEstimated Value: $619,403 - $646,000
4
Beds
3
Baths
3,350
Sq Ft
$189/Sq Ft
Est. Value
About This Home
This home is located at 26727 Lindengate Cir, Plainfield, IL 60585 and is currently estimated at $632,101, approximately $188 per square foot. 26727 Lindengate Cir is a home located in Kendall County with nearby schools including Grande Park Elementary School, Murphy Junior High School, and Oswego East High School.
Ownership History
Date
Name
Owned For
Owner Type
Purchase Details
Closed on
Mar 30, 2006
Sold by
Stefani & Sons Development Co Inc
Bought by
Wachal Donald J and Wachal Jessica J
Current Estimated Value
Home Financials for this Owner
Home Financials are based on the most recent Mortgage that was taken out on this home.
Original Mortgage
$314,500
Outstanding Balance
$181,982
Interest Rate
6.48%
Mortgage Type
Fannie Mae Freddie Mac
Estimated Equity
$450,119
Purchase Details
Closed on
Apr 7, 2004
Sold by
Mpi-1 Development Llc
Bought by
Stefani & Sons Development Co Inc
Home Financials for this Owner
Home Financials are based on the most recent Mortgage that was taken out on this home.
Original Mortgage
$7,200,000
Interest Rate
5.65%
Mortgage Type
Credit Line Revolving
Create a Home Valuation Report for This Property
The Home Valuation Report is an in-depth analysis detailing your home's value as well as a comparison with similar homes in the area
Home Values in the Area
Average Home Value in this Area
Purchase History
| Date | Buyer | Sale Price | Title Company |
|---|---|---|---|
| Wachal Donald J | $434,500 | Chicago Title Insurance Co | |
| Stefani & Sons Development Co Inc | $600,000 | Chicago Title Insurance Co |
Source: Public Records
Mortgage History
| Date | Status | Borrower | Loan Amount |
|---|---|---|---|
| Open | Wachal Donald J | $314,500 | |
| Previous Owner | Stefani & Sons Development Co Inc | $7,200,000 |
Source: Public Records
Tax History
| Year | Tax Paid | Tax Assessment Tax Assessment Total Assessment is a certain percentage of the fair market value that is determined by local assessors to be the total taxable value of land and additions on the property. | Land | Improvement |
|---|---|---|---|---|
| 2024 | $14,304 | $177,137 | $27,450 | $149,687 |
| 2023 | $12,763 | $156,758 | $24,292 | $132,466 |
| 2022 | $12,763 | $142,508 | $22,084 | $120,424 |
| 2021 | $12,675 | $137,027 | $21,235 | $115,792 |
| 2020 | $11,919 | $128,063 | $19,846 | $108,217 |
| 2019 | $11,307 | $120,047 | $19,846 | $100,201 |
| 2018 | $11,478 | $117,348 | $19,400 | $97,948 |
| 2017 | $11,763 | $117,348 | $19,400 | $97,948 |
| 2016 | $12,401 | $121,749 | $30,083 | $91,666 |
| 2015 | $12,589 | $118,203 | $29,207 | $88,996 |
| 2014 | -- | $112,574 | $27,816 | $84,758 |
| 2013 | -- | $112,574 | $27,816 | $84,758 |
Source: Public Records
Map
Nearby Homes
- 13510 S Coronado Cir
- 13526 Coronado Cir
- 13522 S Coronado Cir
- 13522 Coronado Cir
- 13516 S Coronado Cir
- 13534 Coronado Cir
- 13530 S Coronado Cir
- 13530 Coronado Cir
- 13542 S Coronado Cir
- 13537 S Coronado Cir
- 13546 Coronado Cir
- 13504 S Coronado Cir
- 13545 Coronado Cir
- 13545 S Coronado Cir
- 13550 S Coronado Cir
- 13550 Coronado Cir
- 26105 W Grande Park Blvd
- 13553 S Coronado Cir
- 13521 Arborview Cir
- 13548 S Playa Vista Blvd
- 26731 Lindengate Cir
- 26719 Lindengate Cir
- 13425 Lindengate Ct
- 13421 Lindengate Ct
- 26711 Lindengate Cir
- 26737 Lindengate Cir
- 13417 Lindengate Ct
- 26728 Lindengate Cir
- 26724 Lindengate Cir
- 26732 Lindengate Cir
- 13426 Lindengate Ct
- 26720 Lindengate Cir
- 26703 Lindengate Cir
- 26743 Lindengate Cir
- 26736 Lindengate Cir
- 13413 Lindengate Ct
- 26716 Lindengate Cir
- 26661 Lindengate Cir
- 13422 Lindengate Ct
- 26740 Lindengate Cir
Your Personal Tour Guide
Ask me questions while you tour the home.