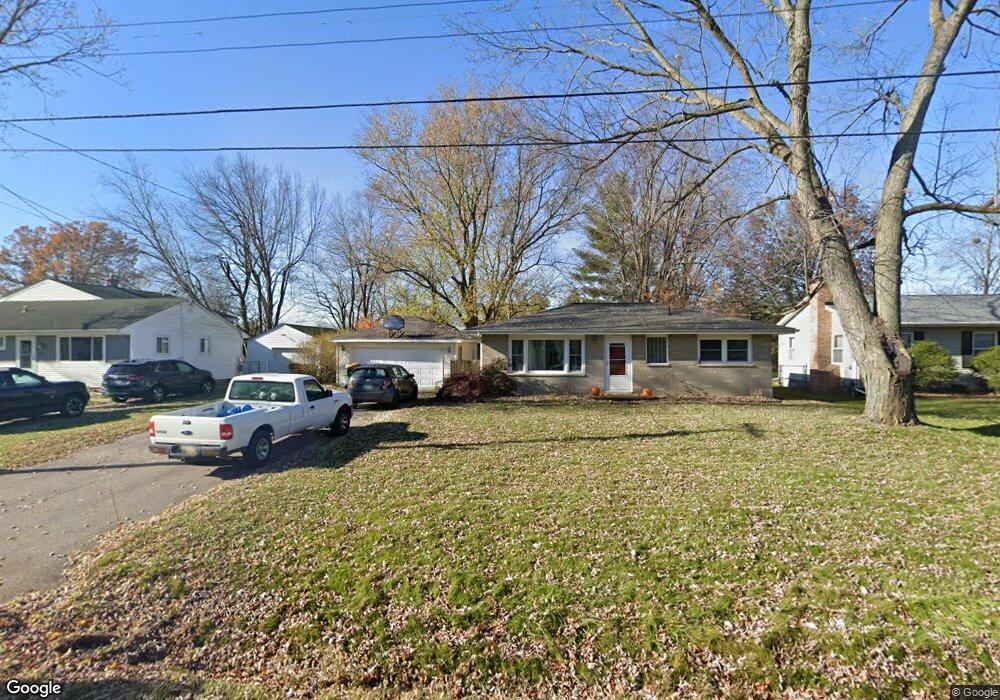
2673 Frank St Lansing, MI 48911
Estimated Value: $144,000 - $202,000
3
Beds
1
Bath
936
Sq Ft
$171/Sq Ft
Est. Value
About This Home
This home is located at 2673 Frank St, Lansing, MI 48911 and is currently estimated at $160,232, approximately $171 per square foot. 2673 Frank St is a home located in Ingham County with nearby schools including Dimondale Elementary School, Washington Woods Middle School, and Holt Junior High School.
Ownership History
Date
Name
Owned For
Owner Type
Purchase Details
Closed on
Apr 13, 2023
Sold by
Walden Troy
Bought by
Sodman Amber L
Current Estimated Value
Purchase Details
Closed on
Oct 11, 2002
Sold by
Hill Donald B and Hill Marilyn H
Bought by
Walden Troy
Home Financials for this Owner
Home Financials are based on the most recent Mortgage that was taken out on this home.
Original Mortgage
$71,200
Interest Rate
6.65%
Mortgage Type
Purchase Money Mortgage
Purchase Details
Closed on
Dec 12, 1997
Purchase Details
Closed on
Aug 1, 1993
Create a Home Valuation Report for This Property
The Home Valuation Report is an in-depth analysis detailing your home's value as well as a comparison with similar homes in the area
Home Values in the Area
Average Home Value in this Area
Purchase History
| Date | Buyer | Sale Price | Title Company |
|---|---|---|---|
| Sodman Amber L | $115,000 | Diversified National Title | |
| Walden Troy | $89,000 | Transnation | |
| -- | $69,500 | -- | |
| -- | $54,500 | -- |
Source: Public Records
Mortgage History
| Date | Status | Borrower | Loan Amount |
|---|---|---|---|
| Previous Owner | Walden Troy | $71,200 |
Source: Public Records
Tax History
| Year | Tax Paid | Tax Assessment Tax Assessment Total Assessment is a certain percentage of the fair market value that is determined by local assessors to be the total taxable value of land and additions on the property. | Land | Improvement |
|---|---|---|---|---|
| 2025 | $3,140 | $62,300 | $32,800 | $29,500 |
| 2024 | $8 | $58,600 | $29,700 | $28,900 |
| 2023 | $2,134 | $49,900 | $24,900 | $25,000 |
| 2022 | $2,071 | $44,900 | $20,800 | $24,100 |
| 2021 | $1,970 | $42,400 | $12,600 | $29,800 |
| 2020 | $2,062 | $39,900 | $12,600 | $27,300 |
| 2019 | $2,048 | $37,200 | $9,700 | $27,500 |
| 2018 | $2,037 | $35,300 | $10,900 | $24,400 |
| 2017 | $1,899 | $35,300 | $10,900 | $24,400 |
| 2016 | $1,957 | $41,000 | $10,900 | $30,100 |
| 2015 | $1,841 | $39,700 | $21,815 | $17,885 |
| 2014 | $1,841 | $35,600 | $21,815 | $13,785 |
Source: Public Records
Map
Nearby Homes
- 2520 Lanier Ct
- 2700 Eaton Rapids Road #193 Rd
- 2616 Michigan 99
- 2658 Sanibel Hollow
- 6235 Yunker St
- 6037 Hughes Rd
- 5902 Haag Rd
- 2340 Washington Rd
- 5650 Hughes Rd
- 5723 Taffy Pkwy
- 6421 S Washington Ave
- 1020 R G Curtiss Ave
- 2145 Aspenwood Dr
- 1015 Brad St
- 1406 Weymouth Ct
- 510 Sawyer Rd
- 5641 Ashley Dr
- 6935 Vernson Dr
- 6444 Sommerset Rd
- 2918 Midwood St
Your Personal Tour Guide
Ask me questions while you tour the home.