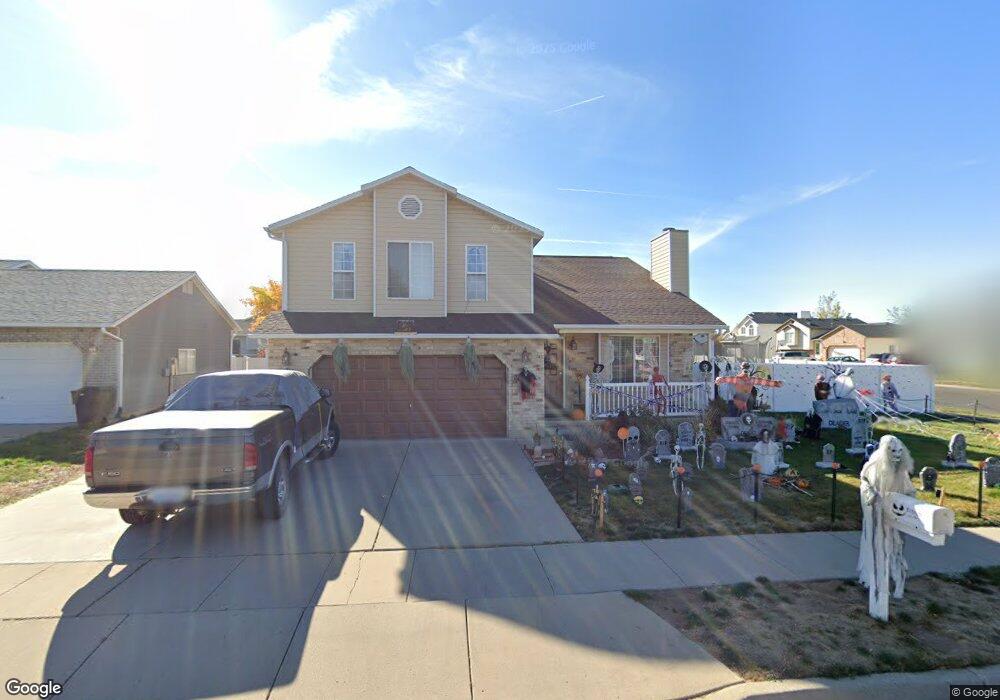
2673 W 1550 N Clearfield, UT 84015
Estimated Value: $459,000 - $479,000
4
Beds
3
Baths
2,051
Sq Ft
$229/Sq Ft
Est. Value
About This Home
This home is located at 2673 W 1550 N, Clearfield, UT 84015 and is currently estimated at $470,286, approximately $229 per square foot. 2673 W 1550 N is a home located in Davis County with nearby schools including West Clinton Elementary School, West Point Junior High School, and Syracuse High School.
Ownership History
Date
Name
Owned For
Owner Type
Purchase Details
Closed on
Aug 28, 2018
Sold by
Hooker Anthony G and Smith Theresa J
Bought by
Edwards Stevens Iii Charles and Edwards Stephaine Stevens
Current Estimated Value
Home Financials for this Owner
Home Financials are based on the most recent Mortgage that was taken out on this home.
Original Mortgage
$265,109
Outstanding Balance
$232,071
Interest Rate
4.87%
Mortgage Type
FHA
Estimated Equity
$238,215
Purchase Details
Closed on
Apr 20, 2009
Sold by
Hadley Van R and Hadley Kaye
Bought by
Hooker Anthony G and Smith Theresa J
Home Financials for this Owner
Home Financials are based on the most recent Mortgage that was taken out on this home.
Original Mortgage
$193,880
Interest Rate
5.02%
Mortgage Type
VA
Create a Home Valuation Report for This Property
The Home Valuation Report is an in-depth analysis detailing your home's value as well as a comparison with similar homes in the area
Home Values in the Area
Average Home Value in this Area
Purchase History
| Date | Buyer | Sale Price | Title Company |
|---|---|---|---|
| Edwards Stevens Iii Charles | -- | First American Title | |
| Hooker Anthony G | -- | First American Title |
Source: Public Records
Mortgage History
| Date | Status | Borrower | Loan Amount |
|---|---|---|---|
| Open | Edwards Stevens Iii Charles | $265,109 | |
| Previous Owner | Hooker Anthony G | $193,880 |
Source: Public Records
Tax History Compared to Growth
Tax History
| Year | Tax Paid | Tax Assessment Tax Assessment Total Assessment is a certain percentage of the fair market value that is determined by local assessors to be the total taxable value of land and additions on the property. | Land | Improvement |
|---|---|---|---|---|
| 2025 | $2,500 | $240,350 | $80,897 | $159,453 |
| 2024 | $2,401 | $232,100 | $89,418 | $142,682 |
| 2023 | $2,270 | $406,000 | $100,868 | $305,132 |
| 2022 | $2,441 | $241,450 | $62,768 | $178,682 |
| 2021 | $2,242 | $329,000 | $76,779 | $252,221 |
| 2020 | $1,948 | $283,000 | $64,305 | $218,695 |
| 2019 | $1,867 | $265,000 | $76,887 | $188,113 |
| 2018 | $1,600 | $223,000 | $65,172 | $157,828 |
| 2016 | $1,506 | $108,405 | $25,180 | $83,225 |
| 2015 | $1,390 | $95,150 | $25,180 | $69,970 |
| 2014 | $1,470 | $102,212 | $25,180 | $77,032 |
| 2013 | -- | $96,908 | $24,320 | $72,588 |
Source: Public Records
Map
Nearby Homes
- 2642 W 1500 N
- 1509 N 2475 W
- 1449 N 2475 W
- 1458 N 2400 W
- 2921 W 1300 N
- 1251 N 2525 W
- 3941 W 1800 N
- 1958 N 2750 W
- 2371 W 1300 N
- 2259 W 1800 N
- 3168 W 1300 N
- 1694 N 2225 W
- 2617 N 2080 W Unit 176
- 2148 W 1570 N
- 2816 W 960 N
- Harvard Plan at Summerfield - Enclave
- 2208 W 2615 N
- Linden Plan at Summerfield - Vista
- Yale Plan at Summerfield - Enclave
- Gambel Oak Plan at Summerfield - Vista