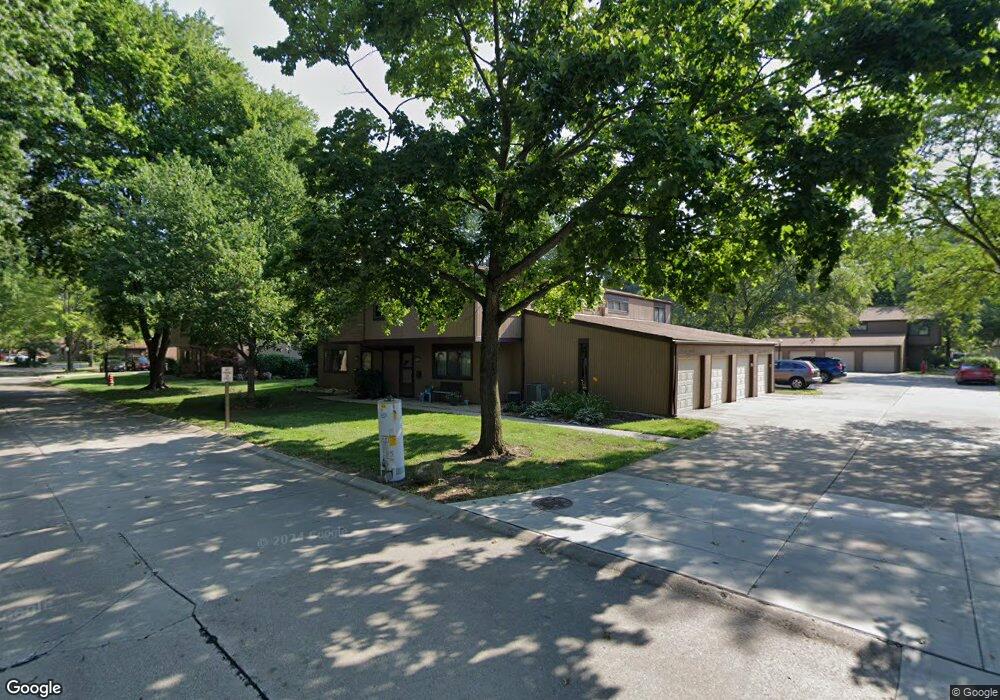
26737 Lake of the Falls Blvd Olmsted Falls, OH 44138
Estimated Value: $157,137 - $174,000
3
Beds
2
Baths
1,292
Sq Ft
$128/Sq Ft
Est. Value
About This Home
This home is located at 26737 Lake of the Falls Blvd, Olmsted Falls, OH 44138 and is currently estimated at $165,784, approximately $128 per square foot. 26737 Lake of the Falls Blvd is a home located in Cuyahoga County with nearby schools including Falls-Lenox Primary Elementary School, Olmsted Falls Intermediate Building, and Olmsted Falls Middle School.
Ownership History
Date
Name
Owned For
Owner Type
Purchase Details
Closed on
Sep 30, 1993
Sold by
Jackson Fred P
Bought by
Perez Emily N
Current Estimated Value
Purchase Details
Closed on
Nov 14, 1991
Sold by
Repenning Sandra L
Bought by
Jackson Fred P
Purchase Details
Closed on
Mar 19, 1991
Sold by
Repenning Russel J and Repenning Sandra
Bought by
Repenning Sandra L
Purchase Details
Closed on
Jul 23, 1986
Sold by
Koesel Margaret M
Bought by
Repenning Russel J and Repenning Sandra
Purchase Details
Closed on
Jun 30, 1981
Sold by
Clark Michael L
Bought by
Koesel Margaret M
Purchase Details
Closed on
Jul 11, 1979
Sold by
Frank James M and Frank Margaret E
Bought by
Clark Michael L
Purchase Details
Closed on
Jan 1, 1975
Bought by
Frank James M and Frank Margaret E
Create a Home Valuation Report for This Property
The Home Valuation Report is an in-depth analysis detailing your home's value as well as a comparison with similar homes in the area
Home Values in the Area
Average Home Value in this Area
Purchase History
| Date | Buyer | Sale Price | Title Company |
|---|---|---|---|
| Perez Emily N | $56,000 | -- | |
| Jackson Fred P | $64,000 | -- | |
| Repenning Sandra L | -- | -- | |
| Repenning Russel J | $54,000 | -- | |
| Koesel Margaret M | $52,900 | -- | |
| Clark Michael L | $46,300 | -- | |
| Frank James M | -- | -- |
Source: Public Records
Tax History Compared to Growth
Tax History
| Year | Tax Paid | Tax Assessment Tax Assessment Total Assessment is a certain percentage of the fair market value that is determined by local assessors to be the total taxable value of land and additions on the property. | Land | Improvement |
|---|---|---|---|---|
| 2024 | $3,103 | $45,745 | $4,270 | $41,475 |
| 2023 | $2,421 | $28,670 | $2,870 | $25,800 |
| 2022 | $2,392 | $28,670 | $2,870 | $25,800 |
| 2021 | $2,368 | $28,670 | $2,870 | $25,800 |
| 2020 | $2,105 | $22,400 | $2,240 | $20,160 |
| 2019 | $1,870 | $64,000 | $6,400 | $57,600 |
| 2018 | $1,957 | $22,400 | $2,240 | $20,160 |
| 2017 | $2,034 | $22,690 | $2,280 | $20,410 |
| 2016 | $2,021 | $22,690 | $2,280 | $20,410 |
| 2015 | $3,352 | $22,690 | $2,280 | $20,410 |
| 2014 | $3,352 | $25,200 | $2,520 | $22,680 |
Source: Public Records
Map
Nearby Homes
- 0 Sprague Rd
- 31100 Blooming Ln
- 27056 Sprague Rd
- 9947 Magnolia Dr Unit 14
- 26511 Locust Dr
- 9112 Devonshire Dr
- 26700 Redwood Dr
- 26183 Raintree Blvd Unit C-10
- 26187 Raintree Blvd Unit C5
- 9159 E Windsor Dr
- 26508 Redwood Dr
- 26179 Raintree Blvd Unit D8
- V/L Usher Rd
- 9954 Ethan Dr
- 0 E River Rd Unit 5120285
- 9628 Kingston Trail
- Caroline Plan at Falls Landing - Villas
- Wexford Plan at Falls Landing - Villas
- Rosecliff Plan at Falls Landing - Villas
- 1046 Ashford Ct
- 26735 Lake of the Falls Blvd Unit 26735
- 26741 Lake of the Falls Blvd
- 26729 Lake of the Falls Blvd
- 26731 Lake of the Falls Blvd
- 26727 Lake of the Falls Blvd
- 26733 Lake of the Falls Blvd Unit 26733
- 26717 Lake of the Falls Blvd
- 26757 Lake of the Falls Blvd
- 26753 Lake of the Falls Blvd
- 26713 Lake of the Falls Blvd Unit 26713
- 26721 Lake of the Falls Blvd Unit 26701
- 26898 Sprague Rd
- 26725 Lake of the Falls Blvd
- 26723 Lake of the Falls Blvd
- 26703 Lake of the Falls Blvd Unit 26703
- 26703 Sprague Rd
- 26743 Lake of the Falls Blvd
- 26701 Lake of the Falls Blvd
- 26705 Lake of the Falls Blvd Unit 6705
- 26695 Lake of the Falls Blvd