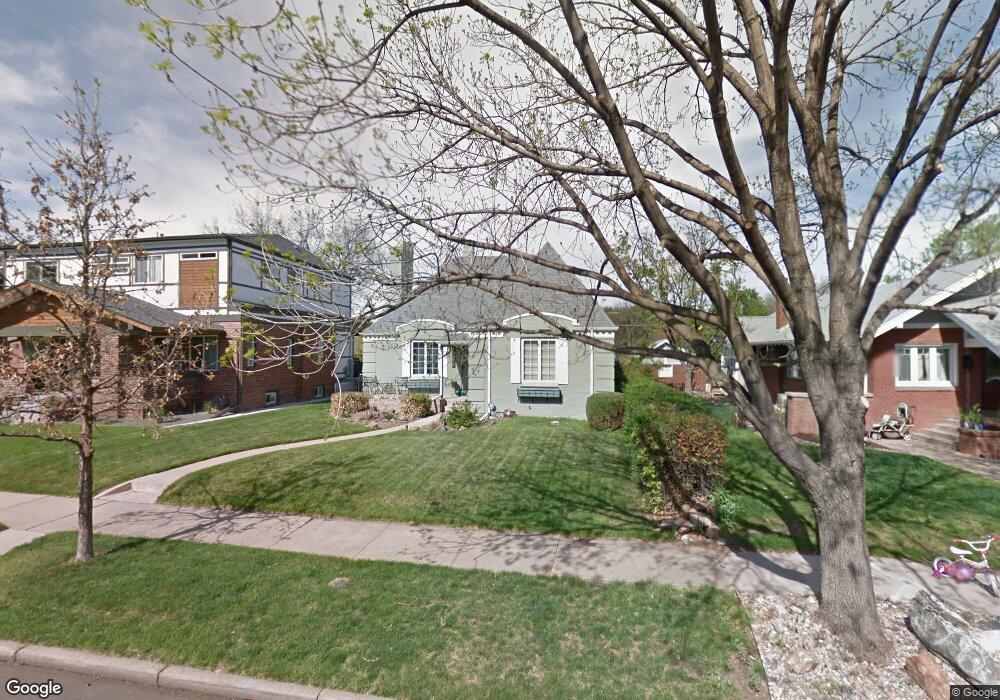
2675 Cherry St Denver, CO 80207
North Park Hill NeighborhoodEstimated Value: $781,000 - $949,000
2
Beds
2
Baths
1,253
Sq Ft
$706/Sq Ft
Est. Value
About This Home
This home is located at 2675 Cherry St, Denver, CO 80207 and is currently estimated at $884,166, approximately $705 per square foot. 2675 Cherry St is a home located in Denver County with nearby schools including Stedman Elementary School, William (Bill) Roberts ECE-8 School, and McAuliffe International School.
Ownership History
Date
Name
Owned For
Owner Type
Purchase Details
Closed on
Mar 14, 2007
Sold by
Sheeler Penny E
Bought by
Binford Tracie R
Current Estimated Value
Home Financials for this Owner
Home Financials are based on the most recent Mortgage that was taken out on this home.
Original Mortgage
$272,000
Outstanding Balance
$161,703
Interest Rate
6.3%
Mortgage Type
Purchase Money Mortgage
Estimated Equity
$722,463
Purchase Details
Closed on
Sep 30, 2003
Sold by
Hutchins Phillip W and Hutchins Amy T
Bought by
Sheeler Penny E
Home Financials for this Owner
Home Financials are based on the most recent Mortgage that was taken out on this home.
Original Mortgage
$150,000
Interest Rate
5.99%
Mortgage Type
Purchase Money Mortgage
Purchase Details
Closed on
Jul 27, 2001
Sold by
Pechon Julianne M
Bought by
Hutchins Phillip W and Hutchins Amy T
Home Financials for this Owner
Home Financials are based on the most recent Mortgage that was taken out on this home.
Original Mortgage
$247,200
Interest Rate
7.14%
Purchase Details
Closed on
Oct 9, 1998
Sold by
Garrett Marguerite E
Bought by
Pechon Julianne M
Create a Home Valuation Report for This Property
The Home Valuation Report is an in-depth analysis detailing your home's value as well as a comparison with similar homes in the area
Home Values in the Area
Average Home Value in this Area
Purchase History
| Date | Buyer | Sale Price | Title Company |
|---|---|---|---|
| Binford Tracie R | $340,000 | None Available | |
| Sheeler Penny E | $330,000 | Landmark Title | |
| Hutchins Phillip W | $309,000 | -- | |
| Pechon Julianne M | $155,000 | -- |
Source: Public Records
Mortgage History
| Date | Status | Borrower | Loan Amount |
|---|---|---|---|
| Open | Binford Tracie R | $272,000 | |
| Previous Owner | Sheeler Penny E | $150,000 | |
| Previous Owner | Hutchins Phillip W | $247,200 |
Source: Public Records
Tax History
| Year | Tax Paid | Tax Assessment Tax Assessment Total Assessment is a certain percentage of the fair market value that is determined by local assessors to be the total taxable value of land and additions on the property. | Land | Improvement |
|---|---|---|---|---|
| 2025 | $4,366 | $62,720 | $31,330 | $31,330 |
| 2024 | $4,366 | $55,120 | $26,090 | $29,030 |
| 2023 | $4,271 | $55,120 | $26,090 | $29,030 |
| 2022 | $3,451 | $43,390 | $28,830 | $14,560 |
| 2021 | $3,331 | $44,640 | $29,660 | $14,980 |
| 2020 | $3,205 | $43,200 | $25,420 | $17,780 |
| 2019 | $3,115 | $43,200 | $25,420 | $17,780 |
| 2018 | $2,844 | $36,760 | $17,060 | $19,700 |
| 2017 | $2,835 | $36,760 | $17,060 | $19,700 |
| 2016 | $2,760 | $33,840 | $8,493 | $25,347 |
| 2015 | $2,644 | $33,840 | $8,493 | $25,347 |
| 2014 | $2,253 | $27,130 | $6,607 | $20,523 |
Source: Public Records
Map
Nearby Homes
- 2645 Cherry St
- 2835 Cherry St
- 2860 Dahlia St
- 2620 Bellaire St
- 2827 Bellaire St
- 2541 Elm St
- 2314 Dexter St
- 3070 Cherry St
- 2600 Colorado Blvd
- 3080 Dahlia St
- 2870 Forest St
- 3993 Haddon Rd
- 3065 Bellaire St
- 2995 Albion St
- 2812 Harrison St
- 3099 Elm St
- 3917 Haddon Rd
- 3055 Ash St
- 3301 Bellaire St
- 2209 Ash St
- 2681 Cherry St
- 2693 Cherry St
- 2659 Cherry St Unit 2661
- 2661 Cherry St
- 2678 Clermont St
- 2684 Clermont St
- 2692 Clermont St
- 2668 Clermont St
- 2653 Cherry St
- 2660 Clermont St
- 2674 Cherry St
- 2684 Cherry St
- 2664 Cherry St
- 2692 Cherry St
- 2662 Cherry St
- 2652 Clermont St
- 2652 Cherry St
- 2800 Clermont St
- 2809 Cherry St
- 2646 Clermont St
Your Personal Tour Guide
Ask me questions while you tour the home.