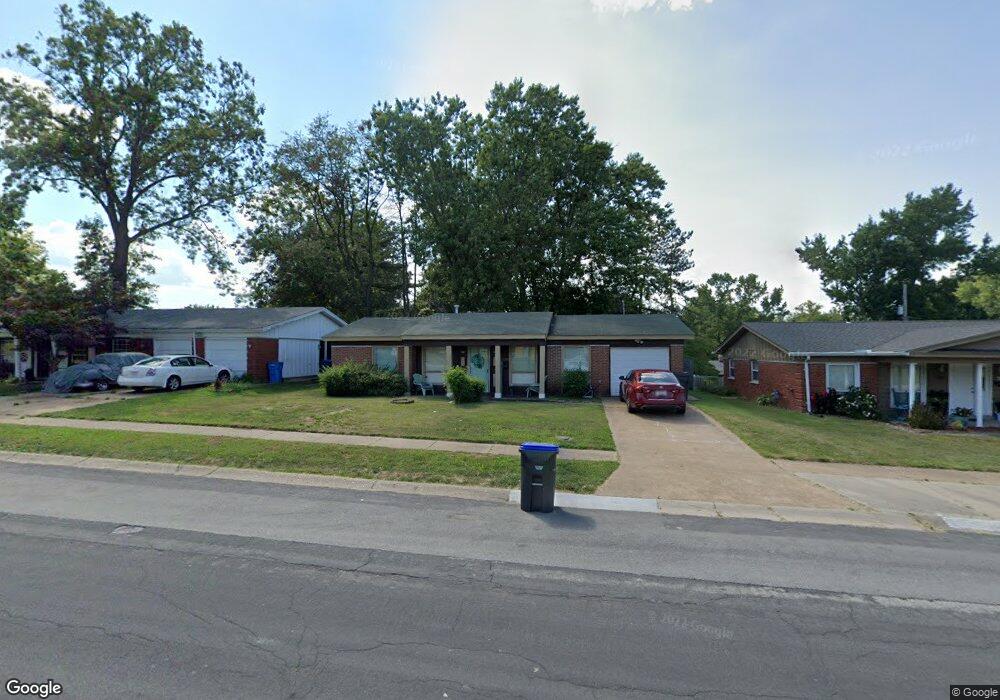
2675 Derhake Rd Florissant, MO 63033
Estimated Value: $144,000 - $237,000
3
Beds
2
Baths
1,120
Sq Ft
$171/Sq Ft
Est. Value
About This Home
This home is located at 2675 Derhake Rd, Florissant, MO 63033 and is currently estimated at $191,555, approximately $171 per square foot. 2675 Derhake Rd is a home located in St. Louis County with nearby schools including Commons Lane Elementary School, Cross Keys Middle School, and McCluer North High School.
Ownership History
Date
Name
Owned For
Owner Type
Purchase Details
Closed on
Jun 16, 2011
Sold by
Federal National Mortgage Association
Bought by
Pivotal Investments L L C
Current Estimated Value
Purchase Details
Closed on
Oct 5, 2010
Sold by
Mcdaniel Barbara and Mcdaniel George
Bought by
Federal National Mortgage Association
Purchase Details
Closed on
Jan 31, 2000
Sold by
Mark Simon
Bought by
Mcdaniel George and Mcdaniel Barbara
Home Financials for this Owner
Home Financials are based on the most recent Mortgage that was taken out on this home.
Original Mortgage
$62,050
Interest Rate
10.99%
Purchase Details
Closed on
Aug 4, 1998
Sold by
Hartupee Ron
Bought by
Simon Mark
Home Financials for this Owner
Home Financials are based on the most recent Mortgage that was taken out on this home.
Original Mortgage
$55,200
Interest Rate
6.94%
Purchase Details
Closed on
Jul 30, 1998
Sold by
Gertrude Pancoast and Gertrude Kenneth J
Bought by
Hartupee Ron
Home Financials for this Owner
Home Financials are based on the most recent Mortgage that was taken out on this home.
Original Mortgage
$55,200
Interest Rate
6.94%
Create a Home Valuation Report for This Property
The Home Valuation Report is an in-depth analysis detailing your home's value as well as a comparison with similar homes in the area
Home Values in the Area
Average Home Value in this Area
Purchase History
| Date | Buyer | Sale Price | Title Company |
|---|---|---|---|
| Pivotal Investments L L C | $24,412 | Ctc | |
| Federal National Mortgage Association | $92,543 | None Available | |
| Mcdaniel George | $73,000 | -- | |
| Simon Mark | -- | -- | |
| Hartupee Ron | -- | -- |
Source: Public Records
Mortgage History
| Date | Status | Borrower | Loan Amount |
|---|---|---|---|
| Previous Owner | Mcdaniel George | $62,050 | |
| Previous Owner | Simon Mark | $55,200 | |
| Closed | Simon Mark | $24,800 | |
| Closed | Mcdaniel George | $7,300 |
Source: Public Records
Tax History Compared to Growth
Tax History
| Year | Tax Paid | Tax Assessment Tax Assessment Total Assessment is a certain percentage of the fair market value that is determined by local assessors to be the total taxable value of land and additions on the property. | Land | Improvement |
|---|---|---|---|---|
| 2025 | $1,999 | $31,430 | $5,680 | $25,750 |
| 2024 | $1,999 | $25,740 | $3,740 | $22,000 |
| 2023 | $1,992 | $25,740 | $3,740 | $22,000 |
| 2022 | $1,703 | $19,280 | $5,680 | $13,600 |
| 2021 | $1,674 | $19,280 | $5,680 | $13,600 |
| 2020 | $1,773 | $19,270 | $5,680 | $13,590 |
| 2019 | $1,738 | $19,270 | $5,680 | $13,590 |
| 2018 | $1,566 | $15,490 | $1,730 | $13,760 |
| 2017 | $1,558 | $15,490 | $1,730 | $13,760 |
| 2016 | $1,543 | $14,950 | $2,490 | $12,460 |
| 2015 | $1,552 | $14,950 | $2,490 | $12,460 |
| 2014 | $1,322 | $13,110 | $4,140 | $8,970 |
Source: Public Records
Map
Nearby Homes
- 2520 Greenberry Dr
- 3515 Saint Catherine St
- 3435 Saint Catherine St
- 3475 Stonehaven Dr
- 2320 Greenberry Dr
- 990 Saddle Dr
- 3940 Parker Rd
- 2255 Wheatfield Dr
- 1945 Pohlman Rd
- 670 Hargrove Ln
- 4040 Helmkampf Dr
- 3270 Kingsley Dr
- 3140 Saint Catherine St
- 100 Broadmere Dr
- 3150 Parker Rd
- 12415 Danube Dr
- 3190 N Waterford Dr
- 1540 Ascot Terrace
- 3905 Max-Weich Place
- 4244 Miletus Dr
- 2695 Derhake Rd
- 2655 Derhake Rd
- 620 Brookstone Dr
- 2635 Derhake Rd
- 630 Brookstone Dr
- 2715 Derhake Rd
- 640 Brookstone Dr
- 610 Brookstone Dr
- 3695 Saint Catherine St
- 2735 Derhake Rd
- 3675 Saint Catherine St
- 650 Brookstone Dr
- 3715 Greengrass Dr
- 3655 Saint Catherine St
- 3655 St Catherine St
- 3630 Brookstone Dr
- 625 Brookstone Dr
- 2755 Derhake Rd
- 660 Brookstone Dr
- 3735 Greengrass Dr