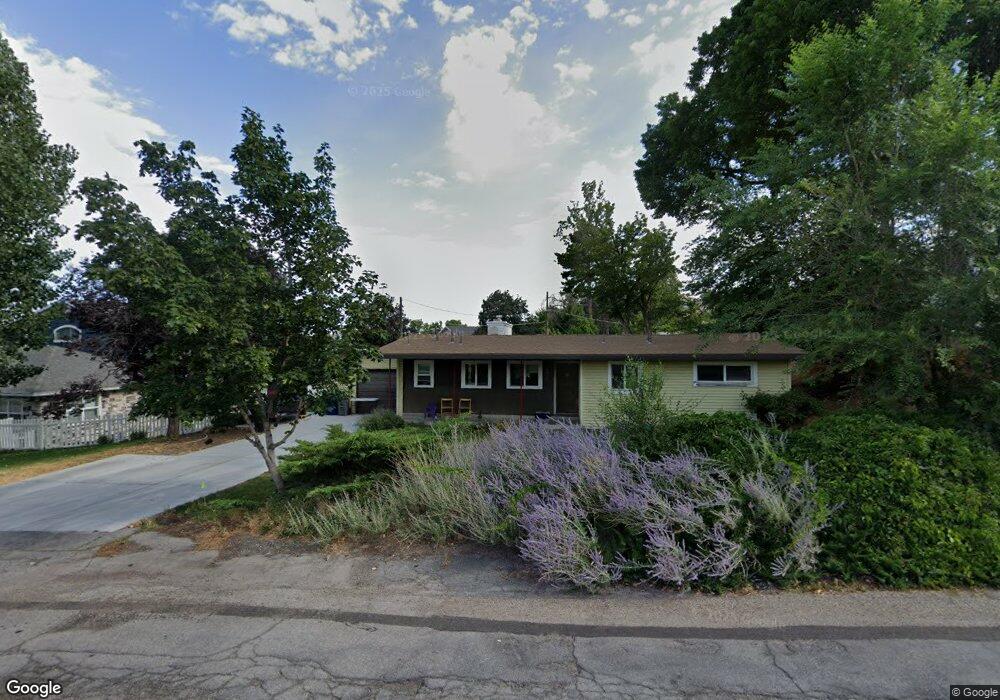
2675 Gregson Ave Salt Lake City, UT 84109
Canyon Rim NeighborhoodEstimated Value: $567,000 - $701,000
3
Beds
2
Baths
1,262
Sq Ft
$499/Sq Ft
Est. Value
About This Home
This home is located at 2675 Gregson Ave, Salt Lake City, UT 84109 and is currently estimated at $629,410, approximately $498 per square foot. 2675 Gregson Ave is a home located in Salt Lake County with nearby schools including Rosecrest Elementary School, Evergreen Junior High School, and Canyon Rim Academy.
Ownership History
Date
Name
Owned For
Owner Type
Purchase Details
Closed on
Feb 26, 2016
Sold by
Mcbride Peter W and Mcbride Ruth M
Bought by
Toone Matthew G and Blakely Laura M
Current Estimated Value
Home Financials for this Owner
Home Financials are based on the most recent Mortgage that was taken out on this home.
Original Mortgage
$256,500
Outstanding Balance
$203,958
Interest Rate
3.79%
Mortgage Type
New Conventional
Estimated Equity
$425,452
Purchase Details
Closed on
Jul 21, 2011
Sold by
Baker Mary Lou and Holton Mary Lou
Bought by
Mcbride Peter W and Mcbride Ruth M
Home Financials for this Owner
Home Financials are based on the most recent Mortgage that was taken out on this home.
Original Mortgage
$165,690
Interest Rate
4.58%
Mortgage Type
FHA
Purchase Details
Closed on
May 22, 1996
Sold by
Baker Richard Max and Baker Thomas Lance
Bought by
Baker Mary Lou and Holton Mary Lou
Create a Home Valuation Report for This Property
The Home Valuation Report is an in-depth analysis detailing your home's value as well as a comparison with similar homes in the area
Home Values in the Area
Average Home Value in this Area
Purchase History
| Date | Buyer | Sale Price | Title Company |
|---|---|---|---|
| Toone Matthew G | -- | Magellan Title | |
| Mcbride Peter W | -- | Provo Land Title Company | |
| Baker Mary Lou | -- | -- |
Source: Public Records
Mortgage History
| Date | Status | Borrower | Loan Amount |
|---|---|---|---|
| Open | Toone Matthew G | $256,500 | |
| Previous Owner | Mcbride Peter W | $165,690 |
Source: Public Records
Tax History Compared to Growth
Tax History
| Year | Tax Paid | Tax Assessment Tax Assessment Total Assessment is a certain percentage of the fair market value that is determined by local assessors to be the total taxable value of land and additions on the property. | Land | Improvement |
|---|---|---|---|---|
| 2025 | $3,255 | $506,300 | $232,200 | $274,100 |
| 2024 | $3,255 | $476,500 | $225,000 | $251,500 |
| 2023 | $3,127 | $455,100 | $197,400 | $257,700 |
| 2022 | $2,943 | $457,300 | $193,500 | $263,800 |
| 2021 | $2,719 | $366,200 | $148,900 | $217,300 |
| 2020 | $2,548 | $323,900 | $144,500 | $179,400 |
| 2019 | $2,362 | $293,400 | $136,400 | $157,000 |
| 2018 | $2,370 | $283,400 | $136,400 | $147,000 |
| 2017 | $2,188 | $274,200 | $136,400 | $137,800 |
| 2016 | $1,782 | $225,400 | $136,400 | $89,000 |
| 2015 | $1,709 | $202,400 | $139,100 | $63,300 |
| 2014 | $1,648 | $190,900 | $136,400 | $54,500 |
Source: Public Records
Map
Nearby Homes
- 2596 E Gregson Ave
- 2776 E 3220 S
- 2835 S 2475 E
- 3123 S 2300 E
- 3094 S 2300 E
- 2961 E Marley Place
- 9556 E 2655 S Unit 34
- 9556 E 2655 S Unit 35
- 2963 S Grace St
- 3420 S Pioneer St
- 3156 E Elgin Dr
- 2193 E Lambourne Ave Unit 3
- 2150 E 3205 S
- 2290 E 2700 S
- 2106 E Connor Park Cove
- 2341 E Neffs Ln
- 3000 S Connor St Unit 11
- 3245 E Cummings Rd
- 2070 E 3335 S Unit 32
- 3685 S Craig Cir
- 2675 E Gregson Ave
- 2665 Gregson Ave
- 3074 S 2700 E
- 3074 S 2700 E Unit 4
- 3066 S 2700 E
- 3061 Linda Cir
- 3061 S Linda Cir
- 3088 S 2700 E
- 3056 S 2700 E
- 2668 Gregson Ave
- 3059 Linda Cir
- 3046 S 2700 E
- 2660 Gregson Ave
- 2660 E Gregson Ave
- 2639 Gregson Ave
- 3057 Linda Cir
- 3057 S Linda Cir
- 2636 Gregson Ave
- 2636 E Gregson Ave
- 3065 S 2700 E