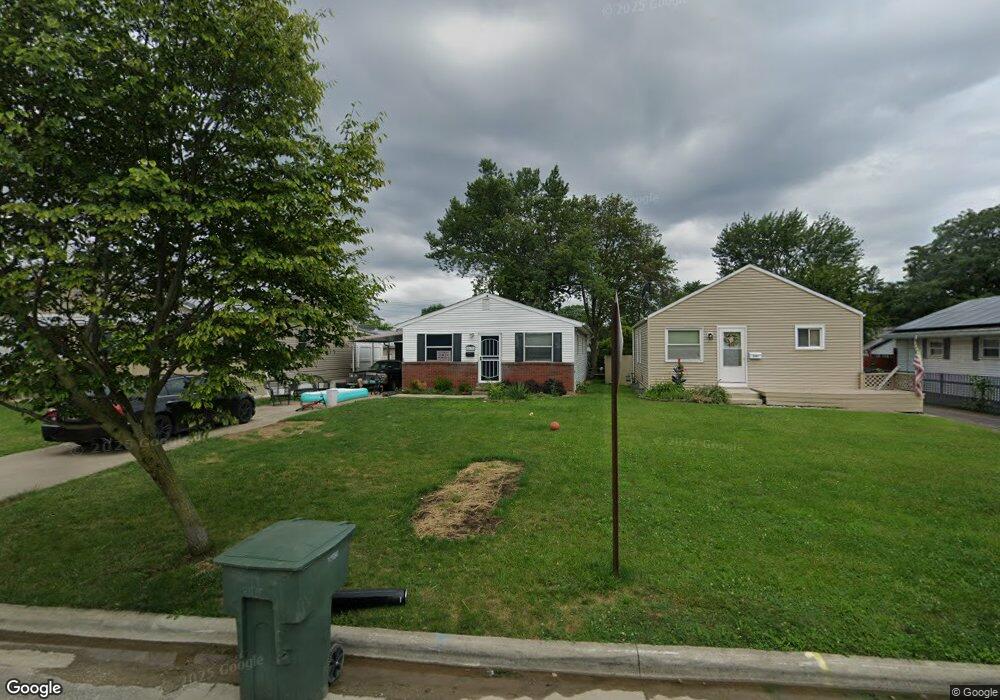
2675 Homecroft Dr Columbus, OH 43211
North Linden NeighborhoodEstimated Value: $129,000 - $176,000
3
Beds
1
Bath
888
Sq Ft
$173/Sq Ft
Est. Value
About This Home
This home is located at 2675 Homecroft Dr, Columbus, OH 43211 and is currently estimated at $153,663, approximately $173 per square foot. 2675 Homecroft Dr is a home located in Franklin County with nearby schools including Como Elementary School, Dominion Middle School, and Whetstone High School.
Ownership History
Date
Name
Owned For
Owner Type
Purchase Details
Closed on
Jan 12, 2024
Sold by
Hibbard Ronald A and Hibbard Karen S
Bought by
Hibbard Family Trust and Hibbard
Current Estimated Value
Purchase Details
Closed on
Feb 28, 2011
Sold by
Tecklenberg Jason Edward
Bought by
Hibbard Ronald A and Hibbard Karen S
Purchase Details
Closed on
Apr 17, 2009
Sold by
Amtrust Bank
Bought by
Tecklenberg Jason Edward
Purchase Details
Closed on
Mar 23, 2009
Sold by
Wohlgemuth Mary J and National City Mortgage Co
Bought by
Amtrust Bank
Purchase Details
Closed on
Jul 1, 1996
Sold by
Neal Joseph E
Bought by
Mary J Wohlgemuth
Home Financials for this Owner
Home Financials are based on the most recent Mortgage that was taken out on this home.
Original Mortgage
$52,863
Interest Rate
8.13%
Mortgage Type
FHA
Purchase Details
Closed on
Dec 10, 1991
Create a Home Valuation Report for This Property
The Home Valuation Report is an in-depth analysis detailing your home's value as well as a comparison with similar homes in the area
Home Values in the Area
Average Home Value in this Area
Purchase History
| Date | Buyer | Sale Price | Title Company |
|---|---|---|---|
| Hibbard Family Trust | -- | None Listed On Document | |
| Hibbard Ronald A | $17,000 | Hostetler | |
| Tecklenberg Jason Edward | $23,500 | Attorney | |
| Amtrust Bank | $36,000 | Allodial | |
| Mary J Wohlgemuth | $53,900 | -- | |
| -- | $48,000 | -- |
Source: Public Records
Mortgage History
| Date | Status | Borrower | Loan Amount |
|---|---|---|---|
| Previous Owner | Mary J Wohlgemuth | $52,863 |
Source: Public Records
Tax History Compared to Growth
Tax History
| Year | Tax Paid | Tax Assessment Tax Assessment Total Assessment is a certain percentage of the fair market value that is determined by local assessors to be the total taxable value of land and additions on the property. | Land | Improvement |
|---|---|---|---|---|
| 2024 | $1,989 | $43,410 | $9,770 | $33,640 |
| 2023 | $1,965 | $43,400 | $9,765 | $33,635 |
| 2022 | $1,066 | $20,060 | $5,110 | $14,950 |
| 2021 | $1,267 | $20,060 | $5,110 | $14,950 |
| 2020 | $1,070 | $20,060 | $5,110 | $14,950 |
| 2019 | $1,045 | $16,810 | $4,450 | $12,360 |
| 2018 | $714 | $16,810 | $4,450 | $12,360 |
| 2017 | $734 | $16,810 | $4,450 | $12,360 |
| 2016 | $423 | $6,230 | $3,710 | $2,520 |
| 2015 | $385 | $6,230 | $3,710 | $2,520 |
| 2014 | $386 | $6,230 | $3,710 | $2,520 |
| 2013 | $225 | $7,350 | $4,375 | $2,975 |
Source: Public Records
Map
Nearby Homes
- 2725 Homecroft Dr
- 744 Arlington Ave
- 2623 Audubon Rd
- 2661 Osceola Ave
- 2751 Pontiac St
- 580 Crestview Rd
- 2495 Pontiac St
- 775 E Weber Rd
- 2544 Azelda St
- 2487 Azelda St
- 2828 Kensington Place W
- 2526 Glenmawr Ave
- 2767 Hiawatha St
- 2810-2812 Azelda St
- 2816 Azelda St
- 2521 Glenmawr Ave
- 525-527 E Tompkins St
- 415 Glen Echo Cir
- 2804 Indianola Ave
- 2836-2838 Indianola Ave Unit 2836
- 2669 Homecroft Dr
- 2681 Homecroft Dr
- 2665 Homecroft Dr
- 2685 Homecroft Dr
- 2659 Homecroft Dr
- 2691 Homecroft Dr
- 2691 Homecroft Dr Unit H
- 2682 Beulah Rd
- 2676 Beulah Rd
- 2688 Beulah Rd
- 2672 Beulah Rd
- 2695 Homecroft Dr
- 2692 Beulah Rd
- 2666 Beulah Rd
- 2701 Homecroft Dr
- 2698 Beulah Rd
- 2674 Homecroft Dr
- 2680 Homecroft Dr
- 2647 Homecroft Dr
- 2668 Homecroft Dr