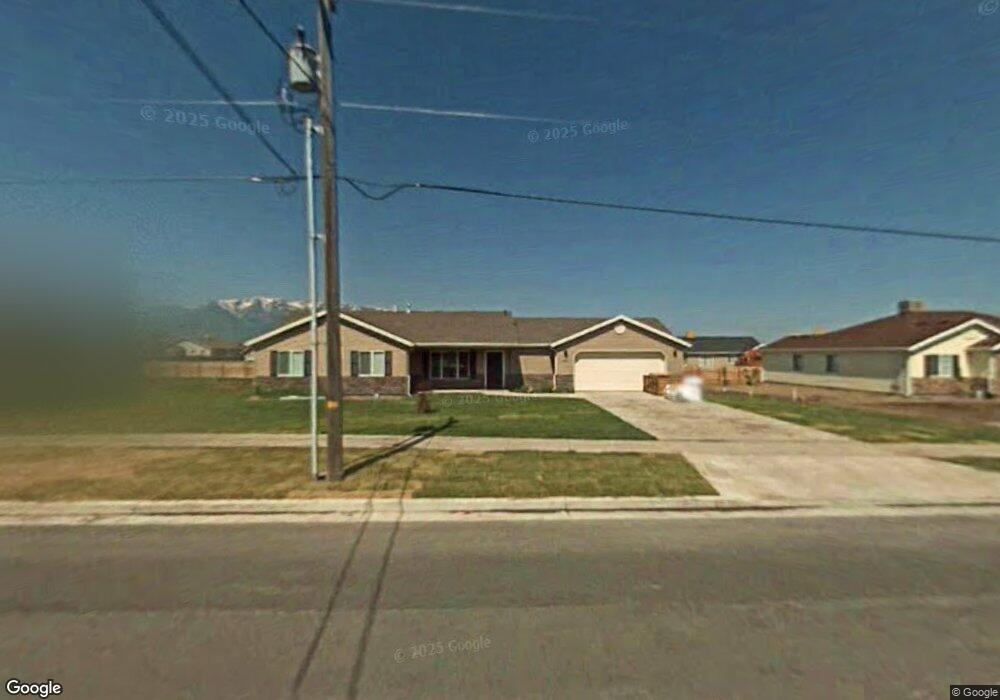
2675 S 800 W Nibley, UT 84321
Estimated Value: $417,000 - $488,000
4
Beds
2
Baths
1,486
Sq Ft
$301/Sq Ft
Est. Value
About This Home
This home is located at 2675 S 800 W, Nibley, UT 84321 and is currently estimated at $446,930, approximately $300 per square foot. 2675 S 800 W is a home located in Cache County with nearby schools including Nibley School, Spring Creek Middle School, and South Cache Middle School.
Ownership History
Date
Name
Owned For
Owner Type
Purchase Details
Closed on
Sep 12, 2025
Sold by
Valent Kyle and Valent Sarah
Bought by
Valent Sarah and Valent Kyle
Current Estimated Value
Home Financials for this Owner
Home Financials are based on the most recent Mortgage that was taken out on this home.
Original Mortgage
$418,328
Outstanding Balance
$418,328
Interest Rate
6.63%
Mortgage Type
FHA
Estimated Equity
$28,602
Purchase Details
Closed on
Nov 3, 2023
Sold by
Garcia Emilee and Garcia Jesus Domingo
Bought by
Valenti Kyle and Valent Sarah
Home Financials for this Owner
Home Financials are based on the most recent Mortgage that was taken out on this home.
Original Mortgage
$412,392
Interest Rate
7.19%
Mortgage Type
FHA
Purchase Details
Closed on
Apr 26, 2021
Sold by
Mathews Mark
Bought by
Garcia Emilee and Garcia Vera Jesus
Home Financials for this Owner
Home Financials are based on the most recent Mortgage that was taken out on this home.
Original Mortgage
$333,450
Interest Rate
3.05%
Mortgage Type
New Conventional
Purchase Details
Closed on
Dec 26, 2019
Sold by
Westre Amanda Jo
Bought by
Mathews Mark
Home Financials for this Owner
Home Financials are based on the most recent Mortgage that was taken out on this home.
Original Mortgage
$214,625
Interest Rate
3.7%
Mortgage Type
New Conventional
Purchase Details
Closed on
Jan 27, 2012
Sold by
Chinen Cristopher C and Chinen Callie Chloe
Bought by
Westre Amanda Jo
Purchase Details
Closed on
May 16, 2007
Sold by
Neighborhood Nonprofit Housing Corporati
Bought by
Chinen Cristopher C and Chinen Callie Chloe
Home Financials for this Owner
Home Financials are based on the most recent Mortgage that was taken out on this home.
Original Mortgage
$139,442
Interest Rate
6.17%
Mortgage Type
Purchase Money Mortgage
Create a Home Valuation Report for This Property
The Home Valuation Report is an in-depth analysis detailing your home's value as well as a comparison with similar homes in the area
Home Values in the Area
Average Home Value in this Area
Purchase History
| Date | Buyer | Sale Price | Title Company |
|---|---|---|---|
| Valent Sarah | -- | Freedom Title Insurance Agency | |
| Valent Sarah | -- | Freedom Title Insurance Agency | |
| Valenti Kyle | -- | Title One Title | |
| Garcia Emilee | -- | American Secure Title Logan | |
| Mathews Mark | -- | American Secure Title Logan | |
| Westre Amanda Jo | -- | American Secure Title Logan | |
| Chinen Cristopher C | -- | Cache Title Company |
Source: Public Records
Mortgage History
| Date | Status | Borrower | Loan Amount |
|---|---|---|---|
| Open | Valent Sarah | $418,328 | |
| Closed | Valent Sarah | $418,328 | |
| Previous Owner | Valenti Kyle | $412,392 | |
| Previous Owner | Garcia Emilee | $333,450 | |
| Previous Owner | Mathews Mark | $214,625 | |
| Previous Owner | Chinen Cristopher C | $139,442 | |
| Closed | Westre Amanda Jo | $0 |
Source: Public Records
Tax History Compared to Growth
Tax History
| Year | Tax Paid | Tax Assessment Tax Assessment Total Assessment is a certain percentage of the fair market value that is determined by local assessors to be the total taxable value of land and additions on the property. | Land | Improvement |
|---|---|---|---|---|
| 2025 | $158 | $209,650 | $0 | $0 |
| 2024 | $1,689 | $210,145 | $0 | $0 |
| 2023 | $1,691 | $197,060 | $0 | $0 |
| 2022 | $2,240 | $250,800 | $0 | $0 |
| 2021 | $1,594 | $277,191 | $65,000 | $212,191 |
| 2020 | $1,507 | $249,514 | $65,000 | $184,514 |
| 2019 | $1,581 | $249,514 | $65,000 | $184,514 |
| 2018 | $1,339 | $206,245 | $41,500 | $164,745 |
| 2017 | $1,338 | $109,120 | $0 | $0 |
| 2016 | $1,353 | $84,155 | $0 | $0 |
| 2015 | $1,037 | $84,155 | $0 | $0 |
| 2014 | $1,013 | $84,155 | $0 | $0 |
| 2013 | -- | $84,100 | $0 | $0 |
Source: Public Records
Map
Nearby Homes