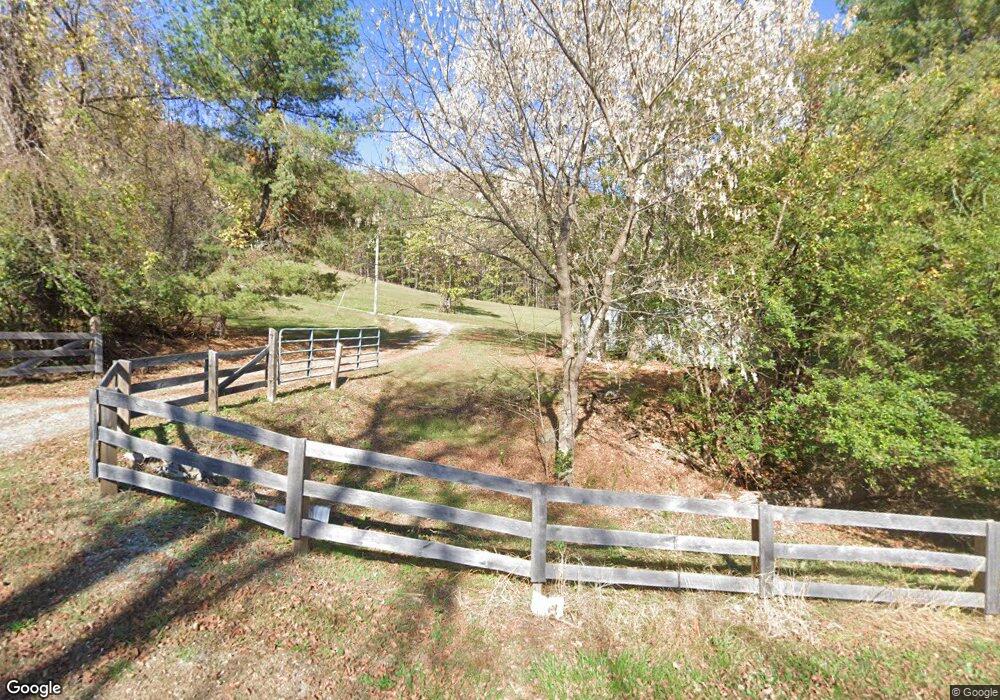
2675 Taylor Mountain Rd Thaxton, VA 24174
Estimated Value: $441,000 - $876,553
4
Beds
3
Baths
2,220
Sq Ft
$299/Sq Ft
Est. Value
About This Home
This home is located at 2675 Taylor Mountain Rd, Thaxton, VA 24174 and is currently estimated at $663,518, approximately $298 per square foot. 2675 Taylor Mountain Rd is a home located in Bedford County with nearby schools including Montvale Elementary School, Liberty Middle School, and Liberty High School.
Ownership History
Date
Name
Owned For
Owner Type
Purchase Details
Closed on
Apr 11, 2017
Sold by
May Tjinta E and The Tjinta E May Trust Dated J
Bought by
May Tjinta E
Current Estimated Value
Purchase Details
Closed on
Oct 20, 2014
Sold by
May Tjinta E
Bought by
May Tjinta E and Tjinta E May Trust
Purchase Details
Closed on
May 28, 2014
Sold by
May Tjinta E and Tjinta E May Trust
Bought by
May Tjinta E
Home Financials for this Owner
Home Financials are based on the most recent Mortgage that was taken out on this home.
Original Mortgage
$287,100
Interest Rate
4.37%
Mortgage Type
New Conventional
Purchase Details
Closed on
Feb 21, 2012
Sold by
May Tjinta E
Bought by
May Tjinta E and Tjinta E May Trust
Home Financials for this Owner
Home Financials are based on the most recent Mortgage that was taken out on this home.
Original Mortgage
$222,500
Interest Rate
3.88%
Mortgage Type
New Conventional
Create a Home Valuation Report for This Property
The Home Valuation Report is an in-depth analysis detailing your home's value as well as a comparison with similar homes in the area
Purchase History
| Date | Buyer | Sale Price | Title Company |
|---|---|---|---|
| May Tjinta E | -- | None Available | |
| May Tjinta E | -- | None Available | |
| May Tjinta E | -- | Title Source Inc | |
| May Tjinta E | -- | Old Republic National Title | |
| May Tjinta E | -- | Old Republic National Title |
Source: Public Records
Mortgage History
| Date | Status | Borrower | Loan Amount |
|---|---|---|---|
| Closed | May Tjinta E | $287,100 | |
| Closed | May Tjinta E | $222,500 |
Source: Public Records
Tax History
| Year | Tax Paid | Tax Assessment Tax Assessment Total Assessment is a certain percentage of the fair market value that is determined by local assessors to be the total taxable value of land and additions on the property. | Land | Improvement |
|---|---|---|---|---|
| 2025 | $1,772 | $614,800 | $265,500 | $349,300 |
| 2024 | $1,772 | $614,800 | $265,500 | $349,300 |
| 2023 | $1,772 | $216,150 | $0 | $0 |
| 2022 | $1,598 | $159,800 | $0 | $0 |
| 2021 | $1,598 | $319,600 | $73,000 | $246,600 |
| 2020 | $1,598 | $319,600 | $73,000 | $246,600 |
| 2019 | $1,598 | $319,600 | $73,000 | $246,600 |
| 2018 | $1,602 | $308,100 | $70,200 | $237,900 |
| 2017 | $1,602 | $308,100 | $70,200 | $237,900 |
| 2016 | $1,602 | $308,100 | $70,200 | $237,900 |
| 2015 | $1,602 | $308,100 | $70,200 | $237,900 |
| 2014 | $1,441 | $277,200 | $59,200 | $218,000 |
Source: Public Records
Map
Nearby Homes
- 0 Taylor Mountain Rd Unit 363976
- 0 Taylor Mountain Rd Unit 923952
- 1188 Crossing Ct
- 0 Goose Creek Vally Rd Unit LotWP001
- 1374 Moccasin Rd
- 326 Robincrest Cir
- 4315 W Lynchburg Salem Turnpike
- 8727 W Lynchburg Salem Turnpike
- 1165 Crouch Rd
- 1081 Stoney Way
- 2352 Union Church Rd
- 1222 Misty Ridge Ln
- 7392 Peaks Rd
- 7585 Peaks Rd
- 1333 Falling Leaf Ln
- 5297 Peaks Rd
- 0 Meadors Mill Rd Unit 364670
- 1319 Montvale St
- 0 Pike Rd Unit 921089
- 0 (Lot 2) Meadors Mill Rd
- 2610 Taylor Mountain Rd
- 2456 Taylor Mountain Rd
- 2672 Taylor Mountain Rd
- 2366 Taylor Mountain Rd
- 2950 Taylor Mountain Rd
- 2300 Taylor Mountain Rd
- 1186 Wideview Dr
- 1054 Riddle Ave
- 1073 Riddle Ave
- 2298 Taylor Mountain Rd
- 3191 Taylor Mountain Rd
- 3137 Taylor Mountain Rd
- 3137 Taylor Mountain Rd
- 3225 Taylor Mountain Rd
- 3134 Taylor Mountain Rd
- 3409 Taylor Mountain Rd
- 3234 Taylor Mountain Rd
- 3417 Taylor Mountain Rd
- 1099 Reba Farm Ln
- 3160 Taylor Mountain Rd
Your Personal Tour Guide
Ask me questions while you tour the home.