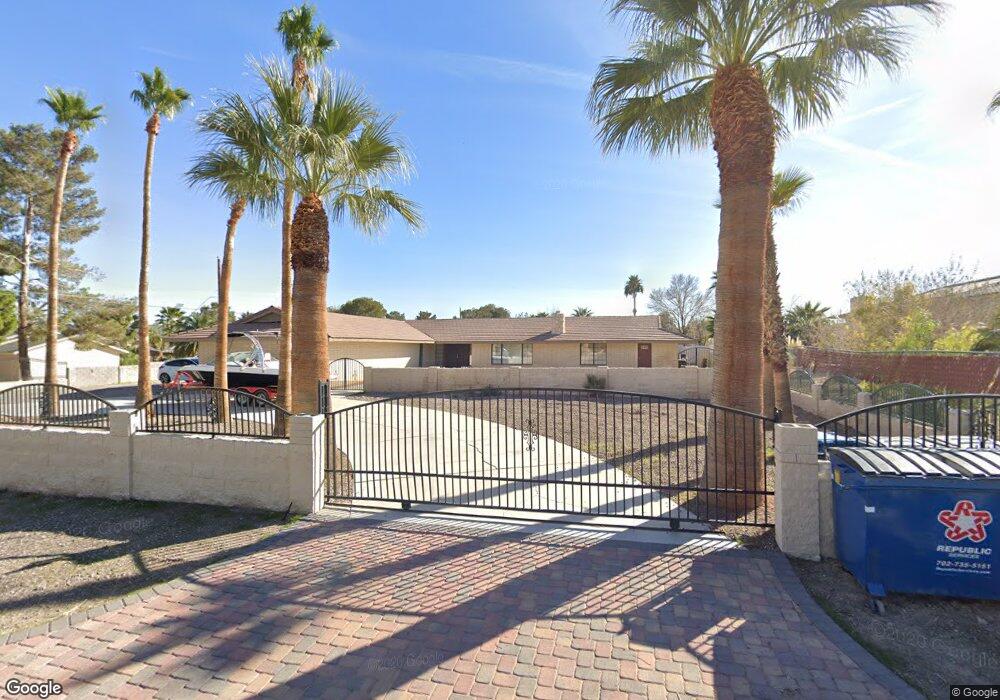
2675 Thurman Ave Las Vegas, NV 89120
Green Valley North NeighborhoodEstimated Value: $708,000 - $911,000
4
Beds
3
Baths
3,066
Sq Ft
$266/Sq Ft
Est. Value
About This Home
This home is located at 2675 Thurman Ave, Las Vegas, NV 89120 and is currently estimated at $815,586, approximately $266 per square foot. 2675 Thurman Ave is a home located in Clark County with nearby schools including David M Cox Elementary School, Barbara and Hank Greenspun Junior High School, and Silverado High School.
Ownership History
Date
Name
Owned For
Owner Type
Purchase Details
Closed on
May 12, 2020
Sold by
Gill Dickson
Bought by
Gil Dickson
Current Estimated Value
Home Financials for this Owner
Home Financials are based on the most recent Mortgage that was taken out on this home.
Original Mortgage
$306,700
Outstanding Balance
$214,529
Interest Rate
3.3%
Mortgage Type
New Conventional
Estimated Equity
$601,057
Purchase Details
Closed on
Oct 7, 2010
Sold by
Bolognese Family Limited Partnership
Bought by
Gil Dickson
Home Financials for this Owner
Home Financials are based on the most recent Mortgage that was taken out on this home.
Original Mortgage
$460,000
Interest Rate
4.26%
Mortgage Type
Seller Take Back
Purchase Details
Closed on
Oct 6, 2010
Sold by
Gil Erica
Bought by
Gil Dickson
Home Financials for this Owner
Home Financials are based on the most recent Mortgage that was taken out on this home.
Original Mortgage
$460,000
Interest Rate
4.26%
Mortgage Type
Seller Take Back
Purchase Details
Closed on
Aug 27, 2008
Sold by
Wachovia Mortgage Fsb
Bought by
Bolognese Family Lp
Purchase Details
Closed on
Jul 30, 2008
Sold by
Fishback Patricia
Bought by
Wachovia Mortgage Fsb and World Savings Bank Fsb
Purchase Details
Closed on
May 1, 2007
Sold by
Fishback Patricia Jo
Bought by
Rowan Pamela
Purchase Details
Closed on
May 3, 2005
Sold by
Coryell Steve
Bought by
Fishback Patricia
Purchase Details
Closed on
May 2, 2005
Sold by
Kay Robert and Fishback Patricia
Bought by
Fishback Patricia
Purchase Details
Closed on
Mar 1, 2005
Sold by
Kay Robert
Bought by
Fishback Patricia
Purchase Details
Closed on
Jun 10, 2003
Sold by
Bolognese Joseph and Bolognese Dorothy Wayne
Bought by
Kay Robert
Home Financials for this Owner
Home Financials are based on the most recent Mortgage that was taken out on this home.
Original Mortgage
$365,600
Interest Rate
5.61%
Mortgage Type
Unknown
Purchase Details
Closed on
Jun 3, 2003
Sold by
Kay Robert and Kay Florine R
Bought by
Kay Robert
Home Financials for this Owner
Home Financials are based on the most recent Mortgage that was taken out on this home.
Original Mortgage
$365,600
Interest Rate
5.61%
Mortgage Type
Unknown
Purchase Details
Closed on
Jun 14, 2000
Sold by
Isani Naureen
Bought by
Qureshi Nawaz A
Purchase Details
Closed on
Jul 20, 1999
Sold by
Qureshi Nawaz Ahmed
Bought by
Isani Naureen
Purchase Details
Closed on
Jul 16, 1998
Sold by
Qureshi Nawaz and Qureshi Sakina
Bought by
Qureshi Nawaz
Create a Home Valuation Report for This Property
The Home Valuation Report is an in-depth analysis detailing your home's value as well as a comparison with similar homes in the area
Home Values in the Area
Average Home Value in this Area
Purchase History
| Date | Buyer | Sale Price | Title Company |
|---|---|---|---|
| Gil Dickson | -- | Title365 | |
| Gil Dickson | $460,000 | North American Title Main | |
| Gil Dickson | -- | North American Title Main | |
| Bolognese Family Lp | $410,000 | Noble Title | |
| Wachovia Mortgage Fsb | $549,900 | None Available | |
| Rowan Pamela | $225,000 | None Available | |
| Fishback Patricia | -- | Chicago Title | |
| Fishback Patricia | -- | Chicago Title | |
| Fishback Patricia | $457,000 | -- | |
| Kay Robert | $457,000 | Land Title Of Nevada | |
| Bolognese Joseph | -- | Land Title Of Nevada | |
| Kay Robert | -- | Land Title Of Nevada | |
| Qureshi Nawaz A | -- | -- | |
| Isani Naureen | -- | -- | |
| Qureshi Nawaz | -- | -- |
Source: Public Records
Mortgage History
| Date | Status | Borrower | Loan Amount |
|---|---|---|---|
| Open | Gil Dickson | $306,700 | |
| Closed | Gil Dickson | $460,000 | |
| Previous Owner | Kay Robert | $365,600 | |
| Closed | Kay Robert | $45,700 |
Source: Public Records
Tax History Compared to Growth
Tax History
| Year | Tax Paid | Tax Assessment Tax Assessment Total Assessment is a certain percentage of the fair market value that is determined by local assessors to be the total taxable value of land and additions on the property. | Land | Improvement |
|---|---|---|---|---|
| 2025 | $4,018 | $138,072 | $66,500 | $71,572 |
| 2024 | $3,913 | $138,072 | $66,500 | $71,572 |
| 2023 | $3,913 | $133,312 | $63,000 | $70,312 |
| 2022 | $3,770 | $128,427 | $63,000 | $65,427 |
| 2021 | $3,716 | $144,452 | $81,200 | $63,252 |
| 2020 | $3,448 | $144,989 | $81,200 | $63,789 |
| 2019 | $3,231 | $142,942 | $79,170 | $63,772 |
| 2018 | $3,083 | $138,677 | $76,125 | $62,552 |
| 2017 | $3,375 | $115,079 | $50,750 | $64,329 |
| 2016 | $2,886 | $115,348 | $40,600 | $74,748 |
| 2015 | $2,880 | $101,527 | $27,300 | $74,227 |
| 2014 | $2,791 | $92,325 | $19,688 | $72,637 |
Source: Public Records
Map
Nearby Homes
- 2926 E Eldorado Ln
- 3120 E Eldorado Ln
- 7450 S Eastern Ave Unit 1024
- 7450 S Eastern Ave Unit 2101
- 7258 Loma Alta Cir
- 353 Lander Terrace
- 7167 La Puebla St
- 7165 Mira Monte Cir
- 2792 Fountain Ridge Ln
- 2786 Fountain Ridge Ln
- 2350 Crooked Creek Ave
- 367 Lander Dr
- 2775 Red Vista Ct
- 2766 Red Vista Ct
- 2657 Storey Cir
- 2838 Via Stella St
- 314 Lander Dr
- 7667 Borealis St
- 3214 Rutledge Dr
- 7672 Celestial Glow St
- 2725 Thurman Ave
- 2655 Thurman Ave
- 7440 Topaz St
- 2686 E Eldorado Ln
- 2775 Thurman Ave
- 0 Thurman Ave
- 2726 E Eldorado Ln Unit 405
- 2695 Thurman Ave
- 7430 Lansing St
- 7440 Lansing St
- 7420 Lansing St
- 2726 Thurman Ave
- 7410 Lansing St
- 7380 Topaz St
- 7460 Lansing St
- 7397 Topaz St
- 7391 Topaz St
- 2826 E Eldorado Ln
- 7470 Lansing St
- 2825 Thurman Ave