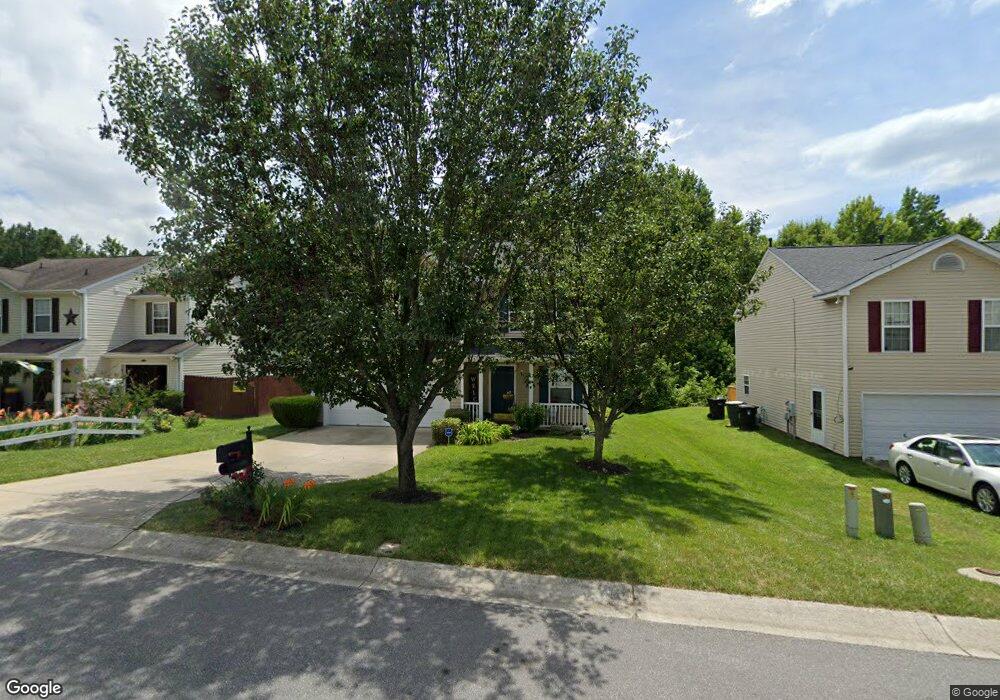
2676 Captains Watch Kannapolis, NC 28083
Estimated Value: $321,000 - $356,000
4
Beds
3
Baths
1,918
Sq Ft
$175/Sq Ft
Est. Value
About This Home
This home is located at 2676 Captains Watch, Kannapolis, NC 28083 and is currently estimated at $335,179, approximately $174 per square foot. 2676 Captains Watch is a home located in Cabarrus County with nearby schools including Forest Park Elementary School, Kannapolis Middle, and A.L. Brown High School.
Ownership History
Date
Name
Owned For
Owner Type
Purchase Details
Closed on
Jul 29, 2021
Sold by
Crawford Terrance N and Crawford Courtney
Bought by
White Princess
Current Estimated Value
Home Financials for this Owner
Home Financials are based on the most recent Mortgage that was taken out on this home.
Original Mortgage
$260,200
Outstanding Balance
$236,709
Interest Rate
2.93%
Mortgage Type
FHA
Estimated Equity
$98,470
Purchase Details
Closed on
Nov 10, 2005
Sold by
Crawford Terrance N
Bought by
Crawford Terrance N and Crawford Courtney
Home Financials for this Owner
Home Financials are based on the most recent Mortgage that was taken out on this home.
Original Mortgage
$125,100
Interest Rate
6.04%
Mortgage Type
New Conventional
Purchase Details
Closed on
Jul 30, 2004
Sold by
Crossmann Communities Of Nc Inc
Bought by
Crawford Terrance N
Home Financials for this Owner
Home Financials are based on the most recent Mortgage that was taken out on this home.
Original Mortgage
$131,404
Interest Rate
6.22%
Mortgage Type
FHA
Create a Home Valuation Report for This Property
The Home Valuation Report is an in-depth analysis detailing your home's value as well as a comparison with similar homes in the area
Home Values in the Area
Average Home Value in this Area
Purchase History
| Date | Buyer | Sale Price | Title Company |
|---|---|---|---|
| White Princess | $267,000 | Tryon Title Agency Llc | |
| Crawford Terrance N | -- | -- | |
| Crawford Terrance N | $132,500 | -- |
Source: Public Records
Mortgage History
| Date | Status | Borrower | Loan Amount |
|---|---|---|---|
| Open | White Princess | $260,200 | |
| Previous Owner | Crawford Terrance N | $125,100 | |
| Previous Owner | Crawford Terrance N | $131,404 |
Source: Public Records
Tax History Compared to Growth
Tax History
| Year | Tax Paid | Tax Assessment Tax Assessment Total Assessment is a certain percentage of the fair market value that is determined by local assessors to be the total taxable value of land and additions on the property. | Land | Improvement |
|---|---|---|---|---|
| 2025 | $3,050 | $306,200 | $59,000 | $247,200 |
| 2024 | $3,050 | $306,200 | $59,000 | $247,200 |
| 2023 | $2,275 | $186,470 | $35,000 | $151,470 |
| 2022 | $2,222 | $182,120 | $35,000 | $147,120 |
| 2021 | $2,222 | $182,120 | $35,000 | $147,120 |
| 2020 | $2,222 | $182,120 | $35,000 | $147,120 |
| 2019 | $1,593 | $130,570 | $19,000 | $111,570 |
| 2018 | $1,567 | $130,570 | $19,000 | $111,570 |
| 2017 | $1,541 | $130,570 | $19,000 | $111,570 |
| 2016 | $914 | $134,940 | $24,000 | $110,940 |
| 2015 | $1,592 | $134,940 | $24,000 | $110,940 |
| 2014 | $1,592 | $134,940 | $24,000 | $110,940 |
Source: Public Records
Map
Nearby Homes
- 925 Anchor Way NE
- 915 Harbour View Cove NE
- 839 Anchor Way NE
- 4750 J W Cline Rd
- 2495 Centergrove Rd
- 2405 Forrestbrook Dr
- 2416 Forrestbrook Dr
- 2882 Centergrove Rd
- 2245 Heritage Ct Unit 2
- 2458 Saguaro Ln
- 2990 Dale Earnhardt Blvd
- 2485 Acadia Ct
- 3007 Centergrove Rd
- 14 Knowles St
- 512 Villa St
- 4849 Samuel Richard St
- 00 Dixie Dr
- 252 Forest Pond Rd
- 312 Sycamore Ridge Rd NE
- 5100 Patterson Rd
- 2676 Captains Watch Rd NE
- 2680 Captains Watch
- 2672 Captains Watch
- 2684 Captains Watch
- 2668 Captains Watch
- 2668 Captains Watch Rd NE
- 960 Anchor Way NE
- 2688 Captains Watch Rd NE
- 2664 Captains Watch
- 2671 Captains Watch
- 2667 Captains Watch Rd NE
- 965 Anchor Way NE
- 2667 Captains Watch
- 956 Anchor Way NE
- 2660 Captains Watch
- 961 Anchor Way NE
- 2692 Captains Watch
- 2663 Captains Watch
- 2689 Captains Watch
- 952 Anchor Way NE