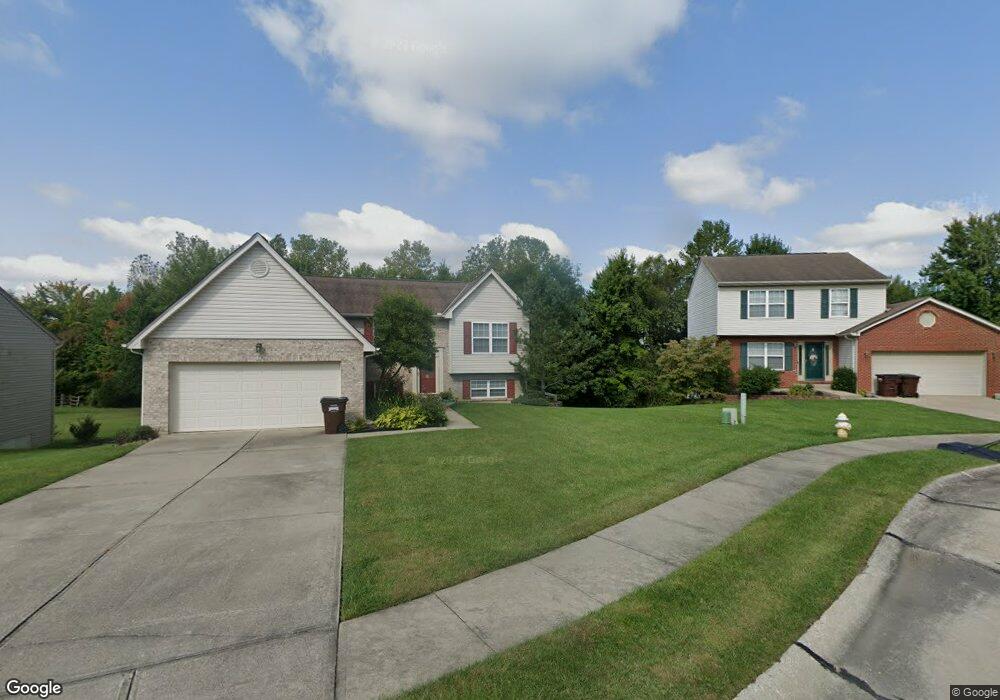
2676 Swaps Ct Burlington, KY 41005
Estimated Value: $269,000 - $291,703
4
Beds
2
Baths
982
Sq Ft
$290/Sq Ft
Est. Value
About This Home
This home is located at 2676 Swaps Ct, Burlington, KY 41005 and is currently estimated at $284,926, approximately $290 per square foot. 2676 Swaps Ct is a home located in Boone County with nearby schools including Goodridge Elementary School, Camp Ernst Middle School, and Conner High School.
Ownership History
Date
Name
Owned For
Owner Type
Purchase Details
Closed on
May 14, 2009
Sold by
Black Daryl L
Bought by
Black Daryl L and Black Vonda C
Current Estimated Value
Purchase Details
Closed on
Jan 5, 2007
Sold by
Eibel Chris S and Ryan Eibel Laura C
Bought by
Black Daryl L
Home Financials for this Owner
Home Financials are based on the most recent Mortgage that was taken out on this home.
Original Mortgage
$128,000
Outstanding Balance
$75,809
Interest Rate
6.05%
Mortgage Type
New Conventional
Estimated Equity
$209,117
Purchase Details
Closed on
Aug 1, 2002
Sold by
Calumet Homes Llc
Bought by
Eibel Chris S and Ryan Laura C
Home Financials for this Owner
Home Financials are based on the most recent Mortgage that was taken out on this home.
Original Mortgage
$111,760
Interest Rate
6.62%
Mortgage Type
New Conventional
Create a Home Valuation Report for This Property
The Home Valuation Report is an in-depth analysis detailing your home's value as well as a comparison with similar homes in the area
Home Values in the Area
Average Home Value in this Area
Purchase History
| Date | Buyer | Sale Price | Title Company |
|---|---|---|---|
| Black Daryl L | -- | Accurate Title Solutions | |
| Black Daryl L | $160,000 | Superior Title Agency Inc | |
| Eibel Chris S | $139,700 | -- |
Source: Public Records
Mortgage History
| Date | Status | Borrower | Loan Amount |
|---|---|---|---|
| Open | Black Daryl L | $128,000 | |
| Previous Owner | Eibel Chris S | $111,760 |
Source: Public Records
Tax History Compared to Growth
Tax History
| Year | Tax Paid | Tax Assessment Tax Assessment Total Assessment is a certain percentage of the fair market value that is determined by local assessors to be the total taxable value of land and additions on the property. | Land | Improvement |
|---|---|---|---|---|
| 2024 | $1,644 | $192,500 | $25,000 | $167,500 |
| 2023 | $1,702 | $192,500 | $25,000 | $167,500 |
| 2022 | $1,699 | $192,500 | $25,000 | $167,500 |
| 2021 | $1,523 | $169,800 | $25,000 | $144,800 |
| 2020 | $1,487 | $169,800 | $25,000 | $144,800 |
| 2019 | $1,386 | $160,000 | $26,000 | $134,000 |
| 2018 | $1,459 | $160,000 | $26,000 | $134,000 |
| 2017 | $1,821 | $160,000 | $26,000 | $134,000 |
| 2015 | $1,808 | $160,000 | $26,000 | $134,000 |
| 2013 | -- | $160,000 | $26,000 | $134,000 |
Source: Public Records
Map
Nearby Homes
- 5553 Strike the Gold Dr
- 2524 Alysheba Dr
- 5597 Strike the Gold Dr
- 2231 Teal Briar Ln Unit 101
- 2340 Sawmill Ct Unit 208
- 2340 Sawmill Ct Unit 311
- 2239 Teal Briar Ln Unit 206
- 2316 Sawmill Ct Unit 309
- 2316 Sawmill Ct Unit 206
- 4895 Dartmouth Dr Unit lot 101
- 2284 Medlock Ln Unit 101
- 2292 Medlock Ln Unit 311
- 4828 Buckhorn Dr
- 2300 Medlock Ln Unit 206
- 4816 Dartmouth Dr
- 1845 Conrad Ln
- 8094 Over Par Ct
- 5874 Bunkers Ave
- 7090 Putters Point Unit 117A
- 3049 Palmer Place
- 2678 Swaps Ct
- 2672 Swaps Ct
- 2682 Swaps Ct
- 2459 Apollo Ct
- 2686 Swaps Ct
- 2670 Swaps Ct
- 2675 Swaps Ct
- 2671 Swaps Ct
- 2677 Swaps Ct
- 2673 Swaps Ct
- 2681 Swaps Ct
- 2690 Swaps Ct
- 2460 Apollo Ct
- 2463 Apollo Ct
- 5576 Strike the Gold Dr
- 2433 Ferdinand Dr
- 2437 Ferdinand Dr
- 5580 Strike the Gold Dr
- 2685 Swaps Ct
- 5572 Strike the Gold Dr