Estimated Value: $614,000 - $900,000
4
Beds
3
Baths
4,579
Sq Ft
$174/Sq Ft
Est. Value
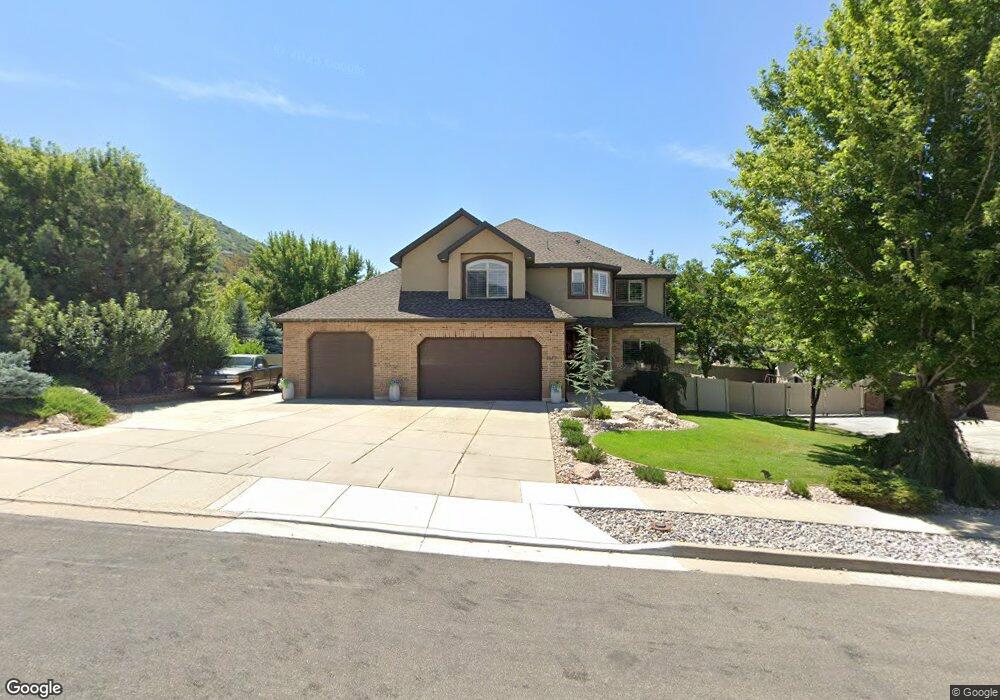
About This Home
This home is located at 2677 E 8150 S, Ogden, UT 84405 and is currently estimated at $795,172, approximately $173 per square foot. 2677 E 8150 S is a home located in Davis County with nearby schools including South Weber Elementary School, Sunset Junior High School, and Northridge High School.
Ownership History
Date
Name
Owned For
Owner Type
Purchase Details
Closed on
Jul 16, 2009
Sold by
Barnes Banking Company
Bought by
Cook William R and Cook Cynthia
Current Estimated Value
Home Financials for this Owner
Home Financials are based on the most recent Mortgage that was taken out on this home.
Original Mortgage
$276,500
Outstanding Balance
$179,171
Interest Rate
5.25%
Mortgage Type
Purchase Money Mortgage
Estimated Equity
$616,001
Purchase Details
Closed on
Jul 8, 2008
Sold by
Hearty Homes Inc
Bought by
Barnes Banking Co
Purchase Details
Closed on
Jan 3, 2007
Sold by
Zion Development Llc
Bought by
Hearty Homes Inc
Home Financials for this Owner
Home Financials are based on the most recent Mortgage that was taken out on this home.
Original Mortgage
$397,500
Interest Rate
6.12%
Mortgage Type
Construction
Create a Home Valuation Report for This Property
The Home Valuation Report is an in-depth analysis detailing your home's value as well as a comparison with similar homes in the area
Purchase History
| Date | Buyer | Sale Price | Title Company |
|---|---|---|---|
| Cook William R | -- | Lincoln Title Ins Agency | |
| Barnes Banking Co | -- | Inwest Title Services Inc | |
| Hearty Homes Inc | -- | Mountain View Title & Escrow |
Source: Public Records
Mortgage History
| Date | Status | Borrower | Loan Amount |
|---|---|---|---|
| Open | Cook William R | $276,500 | |
| Previous Owner | Hearty Homes Inc | $397,500 |
Source: Public Records
Tax History
| Year | Tax Paid | Tax Assessment Tax Assessment Total Assessment is a certain percentage of the fair market value that is determined by local assessors to be the total taxable value of land and additions on the property. | Land | Improvement |
|---|---|---|---|---|
| 2025 | $4,406 | $409,750 | $116,555 | $293,195 |
| 2024 | $4,020 | $381,700 | $94,524 | $287,176 |
| 2023 | $3,940 | $681,000 | $153,325 | $527,675 |
| 2022 | $4,191 | $401,500 | $74,709 | $326,791 |
| 2021 | $3,739 | $545,000 | $112,130 | $432,870 |
| 2020 | $3,356 | $475,000 | $104,655 | $370,345 |
| 2019 | $3,414 | $475,000 | $101,858 | $373,142 |
| 2018 | $3,044 | $443,000 | $93,920 | $349,080 |
| 2016 | $2,979 | $230,945 | $38,493 | $192,452 |
| 2015 | $2,872 | $211,365 | $38,493 | $172,872 |
| 2014 | $3,463 | $262,002 | $44,245 | $217,757 |
| 2013 | -- | $185,833 | $38,252 | $147,581 |
Source: Public Records
Map
Nearby Homes
- 2586 Deer Run Dr
- 8149 S 2425 E
- 7897 S 2700 E Unit 303
- 7897 S 2700 E Unit 305
- 2765 E 7825 S
- 2357 E 8100 S
- 7841 Peachwood Dr
- 3532 N Layton Ridge Dr
- 2772 E 3575 N
- 3297 N Layton Ridge Dr
- 7886 S 2100 E
- 3087 N 2250 E
- 3232 N Redtail Way
- 7478 1980 E
- 2353 Canyon View Dr
- 2569 N 2900 E
- 1827 E Whitetail Dr
- 1809 E Whitetail Dr
- 1821 E Whitetail Way
- 2553 E 6550 S
- 2651 E 8150 S
- 2678 E 8150 S Unit 23
- 2678 E 8150 S
- 2567 E 8150 S
- 2654 E 8150 S Unit 22
- 2633 E 8150 S
- 2632 E 8150 S Unit 21
- 2619 E 8150 S
- 8087 S 2700 E
- 2616 E 8150 S
- 2593 E 8150 S
- 2594 E 8150 S
- 2681 E Sunshine Ct Unit 18
- 2665 E Sunshine Ct
- 2635 E Sunshine Ct
- 8178 S 2570 E
- 2621 E Sunshine Ct
- 8080 S 2575 E
- 8021 S 2700 E
- 8021 S 2700 E Unit 2
Your Personal Tour Guide
Ask me questions while you tour the home.