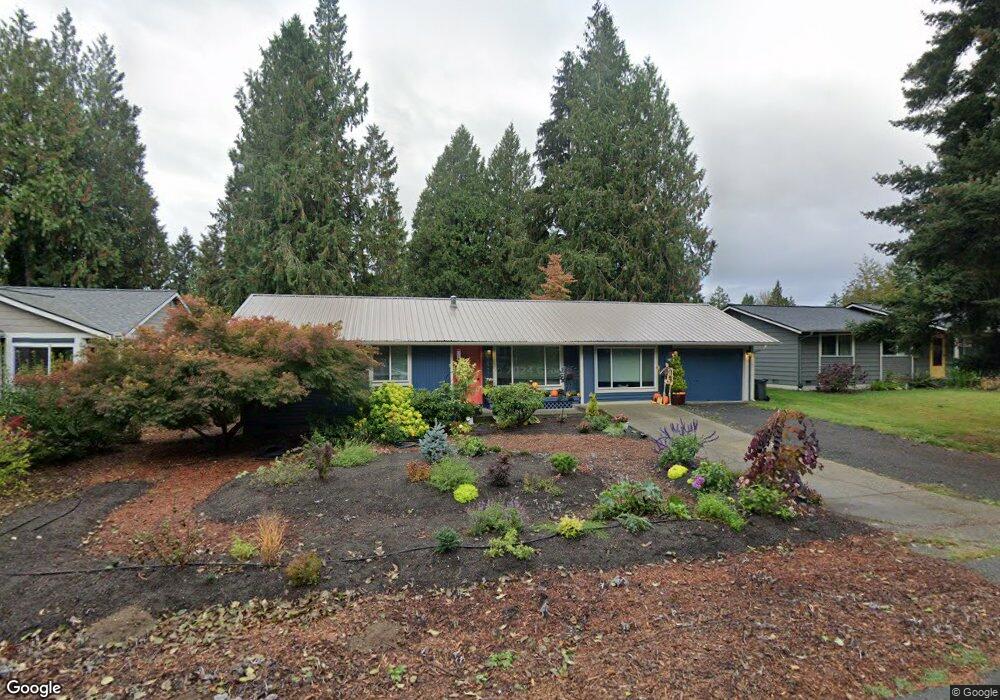
26773 Weaver Rd NW Poulsbo, WA 98370
Lofall NeighborhoodEstimated Value: $424,000 - $486,000
3
Beds
1
Bath
1,145
Sq Ft
$391/Sq Ft
Est. Value
About This Home
This home is located at 26773 Weaver Rd NW, Poulsbo, WA 98370 and is currently estimated at $447,304, approximately $390 per square foot. 26773 Weaver Rd NW is a home located in Kitsap County with nearby schools including Vinland Elementary School, Poulsbo Middle School, and North Kitsap High School.
Ownership History
Date
Name
Owned For
Owner Type
Purchase Details
Closed on
Sep 14, 2009
Sold by
Vogt Lacy
Bought by
Correia Amy L
Current Estimated Value
Home Financials for this Owner
Home Financials are based on the most recent Mortgage that was taken out on this home.
Original Mortgage
$156,000
Outstanding Balance
$101,972
Interest Rate
5.18%
Mortgage Type
New Conventional
Estimated Equity
$345,332
Purchase Details
Closed on
Aug 6, 2008
Sold by
Brubaker Becky L and Brubaker Rodger Lewis
Bought by
Vogt Lacy
Home Financials for this Owner
Home Financials are based on the most recent Mortgage that was taken out on this home.
Original Mortgage
$140,204
Interest Rate
6.42%
Mortgage Type
Unknown
Purchase Details
Closed on
Dec 8, 2000
Sold by
Brubaker Carol M
Bought by
Brubaker Rodger L
Purchase Details
Closed on
Apr 23, 1996
Sold by
Brubaker Rodger Lewis
Bought by
Brubaker Rodger Lewis and Brubaker Carol M
Home Financials for this Owner
Home Financials are based on the most recent Mortgage that was taken out on this home.
Original Mortgage
$55,000
Interest Rate
7.84%
Create a Home Valuation Report for This Property
The Home Valuation Report is an in-depth analysis detailing your home's value as well as a comparison with similar homes in the area
Home Values in the Area
Average Home Value in this Area
Purchase History
| Date | Buyer | Sale Price | Title Company |
|---|---|---|---|
| Correia Amy L | $195,280 | Land Title | |
| Vogt Lacy | $130,280 | Land Title Co | |
| Brubaker Rodger L | -- | -- | |
| Brubaker Rodger Lewis | -- | Transnation Title Insurance |
Source: Public Records
Mortgage History
| Date | Status | Borrower | Loan Amount |
|---|---|---|---|
| Open | Correia Amy L | $156,000 | |
| Previous Owner | Vogt Lacy | $140,204 | |
| Previous Owner | Brubaker Rodger Lewis | $55,000 |
Source: Public Records
Tax History Compared to Growth
Tax History
| Year | Tax Paid | Tax Assessment Tax Assessment Total Assessment is a certain percentage of the fair market value that is determined by local assessors to be the total taxable value of land and additions on the property. | Land | Improvement |
|---|---|---|---|---|
| 2026 | $3,366 | $372,340 | $93,970 | $278,370 |
| 2025 | $3,366 | $372,340 | $93,970 | $278,370 |
| 2024 | $2,805 | $318,250 | $81,270 | $236,980 |
| 2023 | $2,848 | $318,250 | $81,270 | $236,980 |
| 2022 | $2,464 | $260,270 | $67,550 | $192,720 |
| 2021 | $2,341 | $228,770 | $59,100 | $169,670 |
| 2020 | $2,272 | $218,750 | $56,460 | $162,290 |
| 2019 | $2,136 | $204,920 | $52,770 | $152,150 |
| 2018 | $1,980 | $162,300 | $53,830 | $108,470 |
| 2017 | $1,897 | $162,300 | $53,830 | $108,470 |
| 2016 | $1,900 | $149,870 | $53,830 | $96,040 |
| 2015 | $1,785 | $141,570 | $53,830 | $87,740 |
| 2014 | -- | $136,740 | $53,830 | $82,910 |
| 2013 | -- | $136,740 | $53,830 | $82,910 |
Source: Public Records
Map
Nearby Homes
- 26495 NW Edgewater Blvd
- 1918 NW Russell St
- 1799 NW Mulholland Blvd
- 1841 NW Russell St
- 27405 Lofall Ct NW
- 23490 Marinwood Cir NE Unit 1212
- 0 State Hwy 3 NE Unit NWM2410405
- 25749 Pyramid Ln NW
- 1881 NW Seclusion Cove Way
- 0 XXX Sanderling Place NE
- 2 XXX NW Park St
- 25443 Pioneer Way NW
- 1870 NW Vaa Rd
- 27272 Big Valley Rd NE
- 28389 State Highway 3 NE
- 23607 Coburg Place NW
- 23600 Dunbar Place NW
- 24028 Vinland Terrace NW
- 23587 Monument Place NW
- 24478 Johnson Rd NW
- 26797 Weaver Ave NW
- 26797 Weaver Rd NW
- 26753 Weaver Rd NW
- 2188 NW Malnor Ct
- 2192 NW Malnor Ct
- 2184 NW Malnor Ct
- 26727 Weaver Rd NW
- 26875 Weaver Rd NW
- 26774 Weaver Rd NW
- 26774 Weaver Ave NW
- 26798 Weaver Rd NW
- 26754 Weaver Rd NW
- 2180 NW Malnor Ct
- 26709 Weaver Rd NW
- 26826 Weaver Rd NW
- 2281 NW Clinton Ave
- 2218 NW Mulholland Blvd
- 2257 NW Clinton Ave
- 2196 NW Malnor Ct