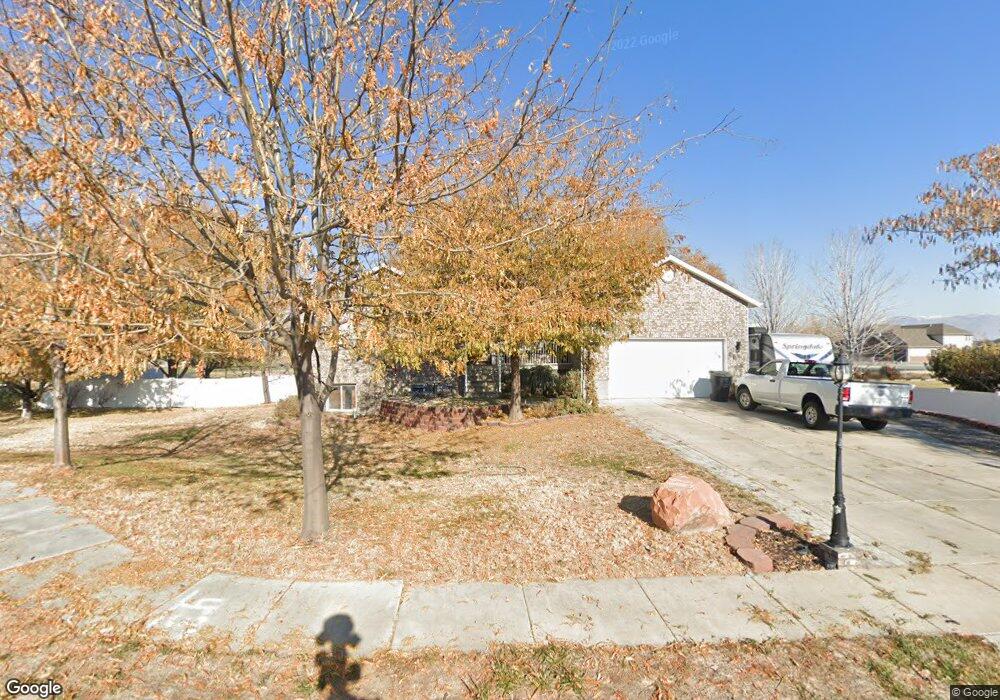
2678 W 1650 N Clearfield, UT 84015
Estimated Value: $403,000 - $451,000
4
Beds
2
Baths
1,920
Sq Ft
$222/Sq Ft
Est. Value
About This Home
This home is located at 2678 W 1650 N, Clearfield, UT 84015 and is currently estimated at $426,558, approximately $222 per square foot. 2678 W 1650 N is a home located in Davis County with nearby schools including West Clinton Elementary School, West Point Junior High School, and Syracuse High School.
Ownership History
Date
Name
Owned For
Owner Type
Purchase Details
Closed on
Oct 19, 2020
Sold by
Nye Scott
Bought by
Nye Scott and Nye Stacie
Current Estimated Value
Home Financials for this Owner
Home Financials are based on the most recent Mortgage that was taken out on this home.
Original Mortgage
$266,000
Outstanding Balance
$235,620
Interest Rate
2.8%
Mortgage Type
New Conventional
Estimated Equity
$190,938
Purchase Details
Closed on
May 17, 2010
Sold by
Sawyer Lynn C and Sawyer Teri Lee
Bought by
Peterson Casey A and Peterson Jackie P
Home Financials for this Owner
Home Financials are based on the most recent Mortgage that was taken out on this home.
Original Mortgage
$4,700
Interest Rate
5.03%
Mortgage Type
Stand Alone Second
Create a Home Valuation Report for This Property
The Home Valuation Report is an in-depth analysis detailing your home's value as well as a comparison with similar homes in the area
Home Values in the Area
Average Home Value in this Area
Purchase History
| Date | Buyer | Sale Price | Title Company |
|---|---|---|---|
| Nye Scott | -- | Accommodation | |
| Nye Scott | -- | Rudd & Hawkers Title Ins Age | |
| Peterson Casey A | -- | Mountain View Title |
Source: Public Records
Mortgage History
| Date | Status | Borrower | Loan Amount |
|---|---|---|---|
| Open | Nye Scott | $266,000 | |
| Previous Owner | Peterson Casey A | $4,700 | |
| Previous Owner | Peterson Casey A | $155,138 |
Source: Public Records
Tax History Compared to Growth
Tax History
| Year | Tax Paid | Tax Assessment Tax Assessment Total Assessment is a certain percentage of the fair market value that is determined by local assessors to be the total taxable value of land and additions on the property. | Land | Improvement |
|---|---|---|---|---|
| 2025 | $2,208 | $212,300 | $93,812 | $118,488 |
| 2024 | $2,157 | $208,450 | $102,757 | $105,693 |
| 2023 | $1,963 | $351,000 | $117,547 | $233,453 |
| 2022 | $2,090 | $206,800 | $71,130 | $135,670 |
| 2021 | $1,949 | $286,000 | $90,356 | $195,644 |
| 2020 | $1,522 | $221,000 | $77,478 | $143,522 |
| 2019 | $1,487 | $211,000 | $89,243 | $121,757 |
| 2018 | $1,320 | $184,000 | $75,210 | $108,790 |
| 2016 | $1,148 | $82,610 | $29,433 | $53,177 |
| 2015 | $1,092 | $74,745 | $29,433 | $45,312 |
| 2014 | $1,045 | $72,686 | $29,433 | $43,253 |
| 2013 | -- | $74,530 | $25,230 | $49,300 |
Source: Public Records
Map
Nearby Homes
- 2642 W 1500 N
- 1958 N 2750 W
- 1509 N 2475 W
- 3941 W 1800 N
- 1449 N 2475 W
- 1458 N 2400 W
- 2921 W 1300 N
- 1251 N 2525 W
- 2259 W 1800 N
- 1694 N 2225 W
- Harvard Plan at Summerfield - Enclave
- 2208 W 2615 N
- Linden Plan at Summerfield - Vista
- Yale Plan at Summerfield - Enclave
- Gambel Oak Plan at Summerfield - Vista
- Cedar Plan at Summerfield - Vista
- Elm Plan at Summerfield - Vista
- Princeton Plan at Summerfield - Enclave
- Cambridge Plan at Summerfield - Enclave
- Cornell Plan at Summerfield - Enclave