Estimated Value: $481,000 - $554,000
About This Home
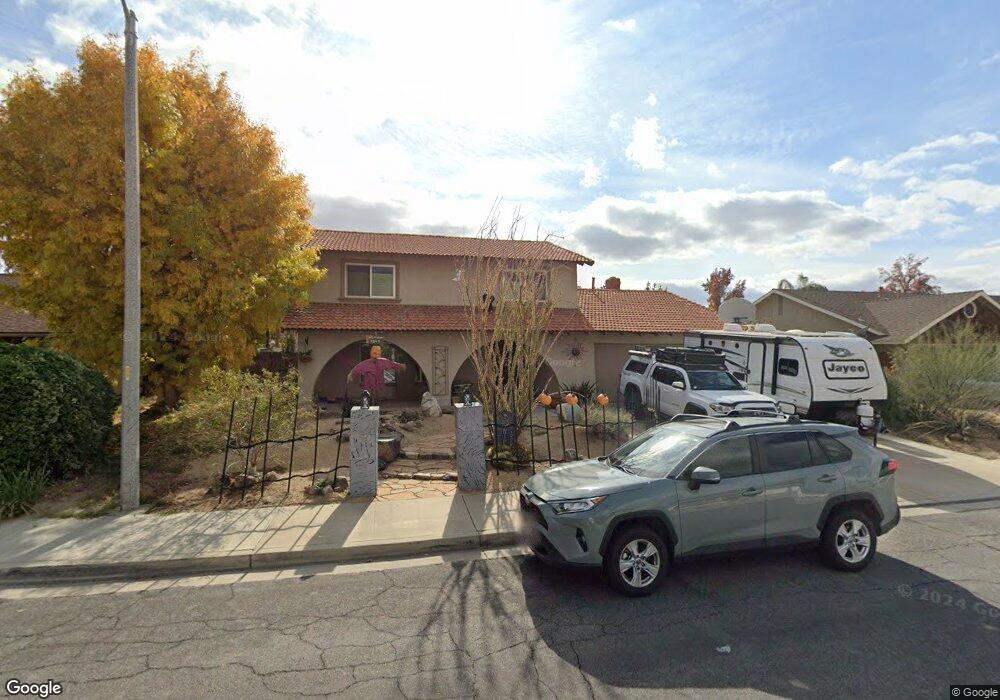
This home is located at 26786 Sol Ct, Hemet, CA 92544 and is currently estimated at $515,023, approximately $242 per square foot. 26786 Sol Ct is a home located in Riverside County with nearby schools including Little Lake Elementary School, Dartmouth Middle School, and Hemet High School.
Ownership History
We collect this data history from publicly available records. To have your information removed, we recommend requesting removal directly through your county’s website.
Purchase Details
Home Financials for this Owner
Home Financials are based on the most recent Mortgage that was taken out on this home.Purchase Details
Home Values in the Area
Average Home Value in this Area
Purchase History
We collect this data history from publicly available records. To have your information removed, we recommend requesting removal directly through your county’s website.
| Date | Buyer | Sale Price | Title Company |
|---|---|---|---|
| $155,000 | Chicago Title Inland Empire | ||
| -- | None Available |
Mortgage History
We collect this data history from publicly available records. To have your information removed, we recommend requesting removal directly through your county’s website.
| Date | Status | Borrower | Loan Amount |
|---|---|---|---|
| Open | $110,000 |
Tax History
We collect this data history from publicly available records. To have your information removed, we recommend requesting removal directly through your county’s website.
| Year | Tax Paid | Tax Assessment Tax Assessment Total Assessment is a certain percentage of the fair market value that is determined by local assessors to be the total taxable value of land and additions on the property. | Land | Improvement |
|---|---|---|---|---|
| 2025 | $2,172 | $198,568 | $25,615 | $172,953 |
| 2023 | $2,172 | $190,859 | $24,621 | $166,238 |
| 2022 | $2,099 | $187,118 | $24,139 | $162,979 |
| 2021 | $2,063 | $183,450 | $23,666 | $159,784 |
| 2020 | $2,040 | $181,570 | $23,424 | $158,146 |
| 2019 | $1,994 | $178,011 | $22,965 | $155,046 |
| 2018 | $1,931 | $174,521 | $22,516 | $152,005 |
| 2017 | $1,906 | $171,100 | $22,075 | $149,025 |
| 2016 | $1,891 | $167,746 | $21,643 | $146,103 |
| 2015 | $1,884 | $165,228 | $21,319 | $143,909 |
| 2014 | $1,798 | $161,993 | $20,902 | $141,091 |
Map
- 26811 Sol Ct
- 26820 Oxford Ct
- 26959 Meridian St
- 41715 Stetson Ave
- 26570 Vassar St
- 41940 Whittier Ave
- 26530 Vassar St
- 41931 Thornton Ave
- 41431 Vicky Ln
- 41358 Johnston Ave
- 41487 Merriwood Dr
- 41797 Shady Ln
- 27266 Pacifica Ct
- 27442 Bancroft Way
- 27560 Cornell St
- 26381 Jepson Ct
- 42162 Carnegie Ave
- 41257 Plumrose St
- 26327 Dartmouth St
- 41691 Erin Dr
Ask me questions while you tour the home.