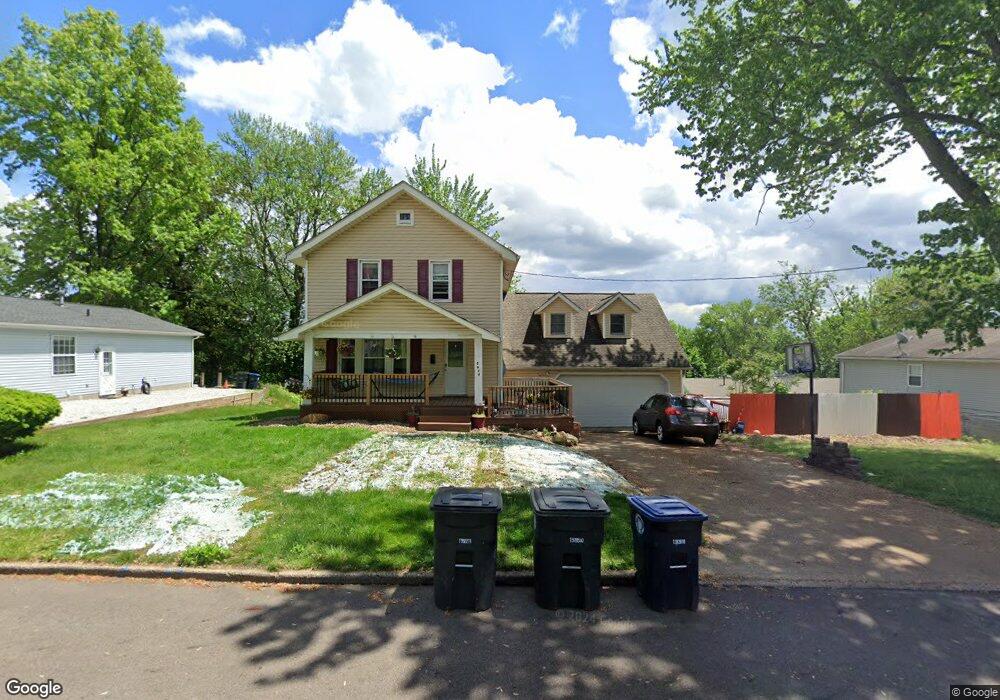
2679 Christensen Ave Akron, OH 44314
Kenmore NeighborhoodEstimated Value: $108,000 - $197,000
3
Beds
2
Baths
1,716
Sq Ft
$91/Sq Ft
Est. Value
About This Home
This home is located at 2679 Christensen Ave, Akron, OH 44314 and is currently estimated at $155,775, approximately $90 per square foot. 2679 Christensen Ave is a home located in Summit County with nearby schools including St. Francis de Sales School and Sam Salem Community Learning Center.
Ownership History
Date
Name
Owned For
Owner Type
Purchase Details
Closed on
May 10, 2023
Sold by
Micale Martin
Bought by
Schromm Rebecca Dawn and Schromm Mitchell Lawrence
Current Estimated Value
Home Financials for this Owner
Home Financials are based on the most recent Mortgage that was taken out on this home.
Original Mortgage
$189,824
Outstanding Balance
$184,478
Interest Rate
6.32%
Mortgage Type
FHA
Estimated Equity
-$28,703
Purchase Details
Closed on
Aug 17, 2021
Sold by
Micale Amanda
Bought by
Micale Martin
Purchase Details
Closed on
Sep 10, 2018
Sold by
Davis Patricia J and Faith Patricia J
Bought by
Micale Martin and Micale Amanda
Home Financials for this Owner
Home Financials are based on the most recent Mortgage that was taken out on this home.
Original Mortgage
$106,236
Interest Rate
4.6%
Mortgage Type
VA
Purchase Details
Closed on
Jan 23, 2008
Sold by
Davis Geoffrey
Bought by
Davis Patricia J and Faith Patricia J
Create a Home Valuation Report for This Property
The Home Valuation Report is an in-depth analysis detailing your home's value as well as a comparison with similar homes in the area
Home Values in the Area
Average Home Value in this Area
Purchase History
| Date | Buyer | Sale Price | Title Company |
|---|---|---|---|
| Schromm Rebecca Dawn | -- | None Listed On Document | |
| Micale Martin | -- | None Available | |
| Micale Martin | $105,000 | None Available | |
| Davis Patricia J | -- | Abby Title |
Source: Public Records
Mortgage History
| Date | Status | Borrower | Loan Amount |
|---|---|---|---|
| Open | Schromm Rebecca Dawn | $189,824 | |
| Previous Owner | Micale Martin | $106,236 |
Source: Public Records
Tax History Compared to Growth
Tax History
| Year | Tax Paid | Tax Assessment Tax Assessment Total Assessment is a certain percentage of the fair market value that is determined by local assessors to be the total taxable value of land and additions on the property. | Land | Improvement |
|---|---|---|---|---|
| 2025 | $1,578 | $45,749 | $5,271 | $40,478 |
| 2024 | $1,578 | $45,749 | $5,271 | $40,478 |
| 2023 | $1,578 | $45,749 | $5,271 | $40,478 |
| 2022 | $1,121 | $33,240 | $3,819 | $29,421 |
| 2021 | $2,262 | $33,240 | $3,819 | $29,421 |
| 2020 | $2,228 | $33,240 | $3,820 | $29,420 |
| 2019 | $2,087 | $28,210 | $3,820 | $24,390 |
| 2018 | $2,059 | $28,210 | $3,820 | $24,390 |
| 2017 | $2,149 | $28,210 | $3,820 | $24,390 |
| 2016 | $2,150 | $29,000 | $3,820 | $25,180 |
| 2015 | $2,149 | $29,000 | $3,820 | $25,180 |
| 2014 | $2,131 | $29,000 | $3,820 | $25,180 |
| 2013 | $2,054 | $28,510 | $3,820 | $24,690 |
Source: Public Records
Map
Nearby Homes
- 2785 Nesmith Lake Blvd
- 2531 Pelton Ave
- 2513 Christensen Ave
- 364 Rexford St
- 363 Lockwood St
- 355 Lockwood St
- 2365 Pelton Ave
- 32 Joyce Ave
- 0 Joyce Ave NW Unit 35 5043152
- 0 Joyce Ave NW Unit 34 5043158
- 55 W Ralston Ave
- 2984 Manchester Rd
- 41 W Woodsdale Ave
- 451 Allenford St
- 594 Shook Rd
- 17 W Woodsdale Ave
- 2996 Kemble Ave
- 838 Stanwood Ave
- 2784 Conway St
- 2836 Unclmorse Ave
- 2675 Christensen Ave
- 2669 Christensen Ave
- 2689 Christensen Ave
- 2690 Nesmith Lake Blvd
- 2698 Nesmith Lake Blvd
- 2686 Nesmith Lake Blvd
- 2665 Christensen Ave
- 2695 Christensen Ave
- 2678 Christensen Ave
- 2704 Nesmith Lake Blvd
- 2704 Nesmith Lake Blvd
- 2682 Christensen Ave
- 2676 Christensen Ave
- 2670 Christensen Ave
- 2680 Nesmith Lake Blvd
- 2666 Christensen Ave
- 2657 Christensen Ave
- 2696 Christensen Ave
- 2662 Christensen Ave
- 2670 Nesmith Lake Blvd