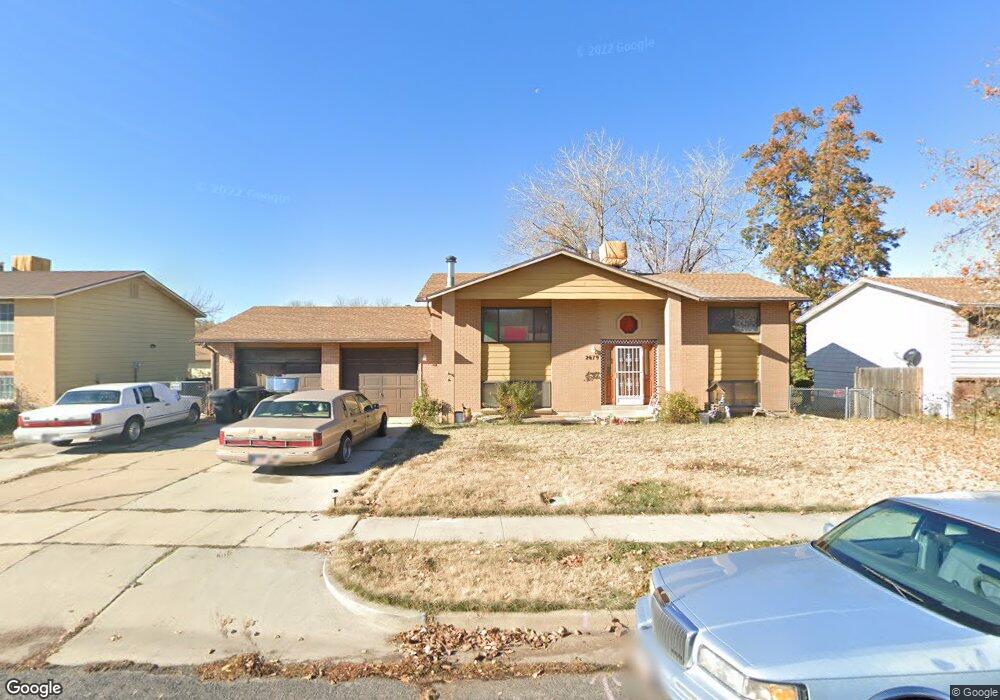
2679 N 950 W Clearfield, UT 84015
Estimated Value: $363,000 - $435,000
2
Beds
2
Baths
1,100
Sq Ft
$354/Sq Ft
Est. Value
About This Home
Property Id: 1679146
Secure fenced patio 1100 sq ft storage furnished cable 2 tvs comfortable washer and dryer
Ownership History
Date
Name
Owned For
Owner Type
Purchase Details
Closed on
Apr 28, 2022
Sold by
Hicks Deborah
Bought by
Lott Ryan
Current Estimated Value
Home Financials for this Owner
Home Financials are based on the most recent Mortgage that was taken out on this home.
Original Mortgage
$317,149
Outstanding Balance
$297,109
Interest Rate
4.16%
Mortgage Type
FHA
Estimated Equity
$92,615
Create a Home Valuation Report for This Property
The Home Valuation Report is an in-depth analysis detailing your home's value as well as a comparison with similar homes in the area
Home Values in the Area
Average Home Value in this Area
Purchase History
| Date | Buyer | Sale Price | Title Company |
|---|---|---|---|
| Lott Ryan | -- | None Listed On Document | |
| Lott Ryan | -- | None Listed On Document |
Source: Public Records
Mortgage History
| Date | Status | Borrower | Loan Amount |
|---|---|---|---|
| Open | Lott Ryan | $317,149 | |
| Closed | Lott Ryan | $317,149 |
Source: Public Records
Property History
| Date | Event | Price | List to Sale | Price per Sq Ft |
|---|---|---|---|---|
| 12/28/2024 12/28/24 | Off Market | $1,550 | -- | -- |
| 12/05/2024 12/05/24 | For Rent | $1,550 | -- | -- |
Tax History Compared to Growth
Tax History
| Year | Tax Paid | Tax Assessment Tax Assessment Total Assessment is a certain percentage of the fair market value that is determined by local assessors to be the total taxable value of land and additions on the property. | Land | Improvement |
|---|---|---|---|---|
| 2025 | $2,772 | $351,574 | $127,564 | $224,010 |
| 2024 | $2,737 | $189,198 | $70,160 | $119,038 |
| 2023 | $2,617 | $183,150 | $64,073 | $119,077 |
| 2022 | $2,776 | $198,550 | $53,079 | $145,471 |
| 2021 | $2,177 | $251,000 | $61,455 | $189,545 |
| 2020 | $822 | $220,000 | $46,093 | $173,907 |
| 2019 | $767 | $193,000 | $41,153 | $151,847 |
| 2018 | $671 | $172,000 | $34,077 | $137,923 |
| 2017 | $748 | $150,001 | $34,077 | $115,924 |
| 2016 | $646 | $71,988 | $16,846 | $55,142 |
| 2015 | $504 | $58,137 | $16,846 | $41,291 |
| 2014 | $460 | $53,936 | $16,846 | $37,090 |
Source: Public Records
Map
Nearby Homes