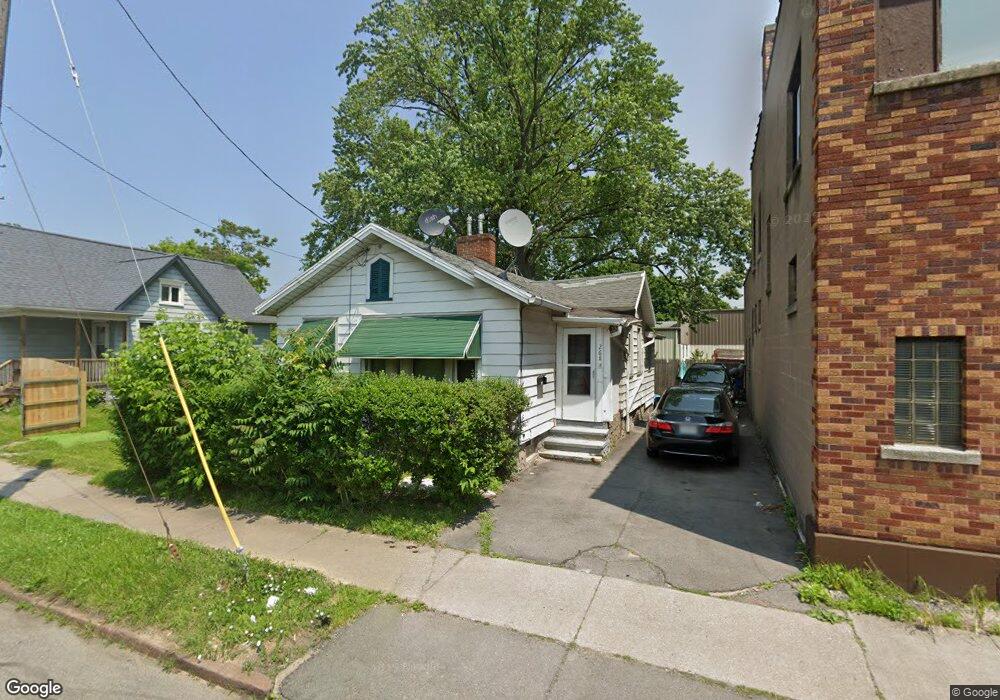
268 Ames St Rochester, NY 14611
Dutchtown NeighborhoodEstimated Value: $60,000 - $83,000
3
Beds
1
Bath
921
Sq Ft
$78/Sq Ft
Est. Value
About This Home
This home is located at 268 Ames St, Rochester, NY 14611 and is currently estimated at $71,638, approximately $77 per square foot. 268 Ames St is a home located in Monroe County with nearby schools including Enrico Fermi School No. 17, John Williams School No. 5, and Dr. Louis A. Cerulli School No. 34.
Ownership History
Date
Name
Owned For
Owner Type
Purchase Details
Closed on
Mar 26, 2021
Sold by
Stone Peak Management Llc
Bought by
Acosta Nazario Darshon A
Current Estimated Value
Purchase Details
Closed on
Oct 4, 2016
Sold by
Ridgecrest Properties Llc
Bought by
Stone Peak Management Llc
Purchase Details
Closed on
Nov 10, 2014
Sold by
Fattore Pamela
Bought by
Ridgecrest Properties Llc
Purchase Details
Closed on
Mar 4, 2008
Sold by
Nitzman Estate Mary
Bought by
Fattore Pamela
Create a Home Valuation Report for This Property
The Home Valuation Report is an in-depth analysis detailing your home's value as well as a comparison with similar homes in the area
Home Values in the Area
Average Home Value in this Area
Purchase History
| Date | Buyer | Sale Price | Title Company |
|---|---|---|---|
| Acosta Nazario Darshon A | $6,000 | None Available | |
| Stone Peak Management Llc | $52,250 | Stewart Title Insurance Co | |
| Ridgecrest Properties Llc | $4,000 | None Available | |
| Fattore Pamela | -- | -- |
Source: Public Records
Tax History Compared to Growth
Tax History
| Year | Tax Paid | Tax Assessment Tax Assessment Total Assessment is a certain percentage of the fair market value that is determined by local assessors to be the total taxable value of land and additions on the property. | Land | Improvement |
|---|---|---|---|---|
| 2024 | $584 | $63,800 | $2,800 | $61,000 |
| 2023 | $361 | $26,700 | $2,400 | $24,300 |
| 2022 | $381 | $26,700 | $2,400 | $24,300 |
| 2021 | $372 | $26,700 | $2,400 | $24,300 |
| 2020 | $377 | $26,700 | $2,400 | $24,300 |
| 2019 | $396 | $24,000 | $2,400 | $21,600 |
| 2018 | $1,052 | $24,000 | $2,400 | $21,600 |
| 2017 | $0 | $24,000 | $2,400 | $21,600 |
| 2016 | $396 | $24,000 | $2,400 | $21,600 |
| 2015 | $1,197 | $24,300 | $2,400 | $21,900 |
| 2014 | $1,197 | $24,300 | $2,400 | $21,900 |
Source: Public Records
Map
Nearby Homes