Estimated Value: $183,000 - $299,000
3
Beds
1
Bath
1,782
Sq Ft
$137/Sq Ft
Est. Value
About This Home
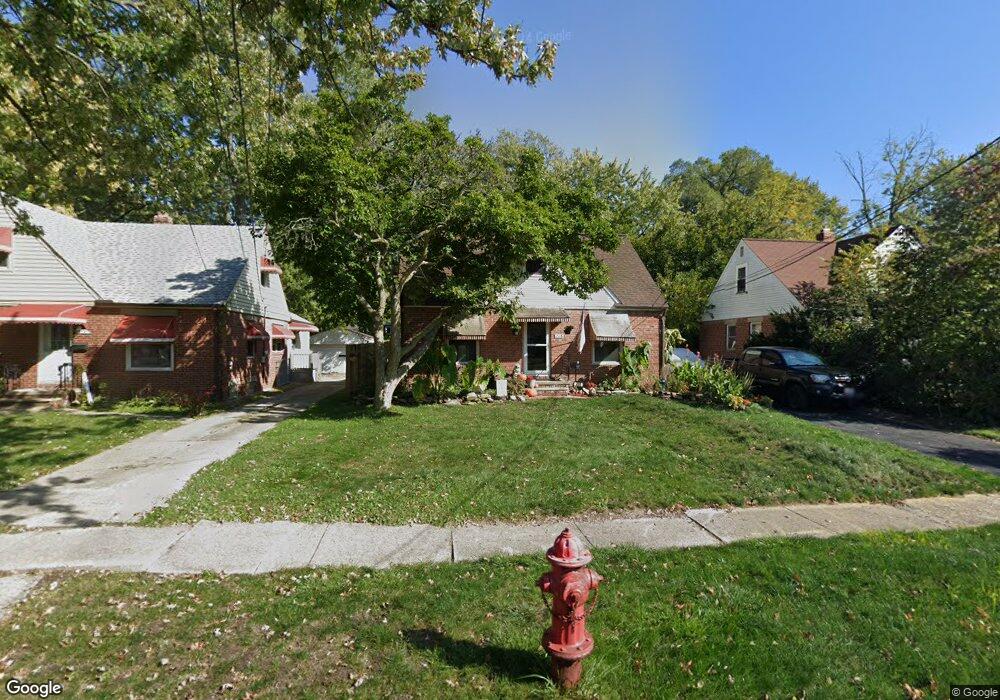
This home is located at 268 Baker St, Berea, OH 44017 and is currently estimated at $244,130, approximately $136 per square foot. 268 Baker St is a home located in Cuyahoga County with nearby schools including Grindstone Elementary School, Berea-Midpark Middle School, and Berea-Midpark High School.
Ownership History
Date
Name
Owned For
Owner Type
Purchase Details
Closed on
May 7, 2009
Sold by
Lass Craig
Bought by
Lass Craig and Lass Jodiann
Current Estimated Value
Purchase Details
Closed on
May 29, 2002
Sold by
Stavole Mark and Falkowski Lorna
Bought by
Lass Craig
Home Financials for this Owner
Home Financials are based on the most recent Mortgage that was taken out on this home.
Original Mortgage
$72,500
Outstanding Balance
$31,066
Interest Rate
7%
Estimated Equity
$213,064
Purchase Details
Closed on
Jan 1, 1975
Bought by
Stavole Josephine
Create a Home Valuation Report for This Property
The Home Valuation Report is an in-depth analysis detailing your home's value as well as a comparison with similar homes in the area
Home Values in the Area
Average Home Value in this Area
Purchase History
| Date | Buyer | Sale Price | Title Company |
|---|---|---|---|
| Lass Craig | -- | Attorney | |
| Lass Craig | $97,500 | Chicago Title Insurance Comp | |
| Stavole Josephine | -- | -- |
Source: Public Records
Mortgage History
| Date | Status | Borrower | Loan Amount |
|---|---|---|---|
| Open | Lass Craig | $72,500 |
Source: Public Records
Tax History
| Year | Tax Paid | Tax Assessment Tax Assessment Total Assessment is a certain percentage of the fair market value that is determined by local assessors to be the total taxable value of land and additions on the property. | Land | Improvement |
|---|---|---|---|---|
| 2024 | $4,278 | $73,955 | $11,900 | $62,055 |
| 2023 | $3,846 | $55,690 | $10,050 | $45,640 |
| 2022 | $3,822 | $55,690 | $10,050 | $45,640 |
| 2021 | $3,789 | $55,690 | $10,050 | $45,640 |
| 2020 | $3,620 | $47,180 | $8,510 | $38,680 |
| 2019 | $3,523 | $134,800 | $24,300 | $110,500 |
| 2018 | $3,497 | $47,180 | $8,510 | $38,680 |
| 2017 | $3,092 | $38,650 | $8,090 | $30,560 |
| 2016 | $3,069 | $38,650 | $8,090 | $30,560 |
| 2015 | $2,901 | $38,650 | $8,090 | $30,560 |
| 2014 | $2,901 | $38,650 | $8,090 | $30,560 |
Source: Public Records
Map
Nearby Homes
- 146 Marian Ln
- 160 Marian Ln Unit 6A
- 211 W Bridge St
- 209 Gibson St
- 216 Kraft St
- 404 Crescent Dr
- 300 West St
- 287 Edgewood Dr
- 47 Prospect St
- 445 Berea St
- 452 N Rocky River Dr
- 388 Fairwood Cir
- 628 Lindbergh Blvd
- 93 W 5th Ave
- 487 Karen Dr
- 41 W 5th Ave
- 115 S Rocky River Dr Unit 201
- 56 3rd Ave
- 550 Race St
- 428 Park Place
Your Personal Tour Guide
Ask me questions while you tour the home.