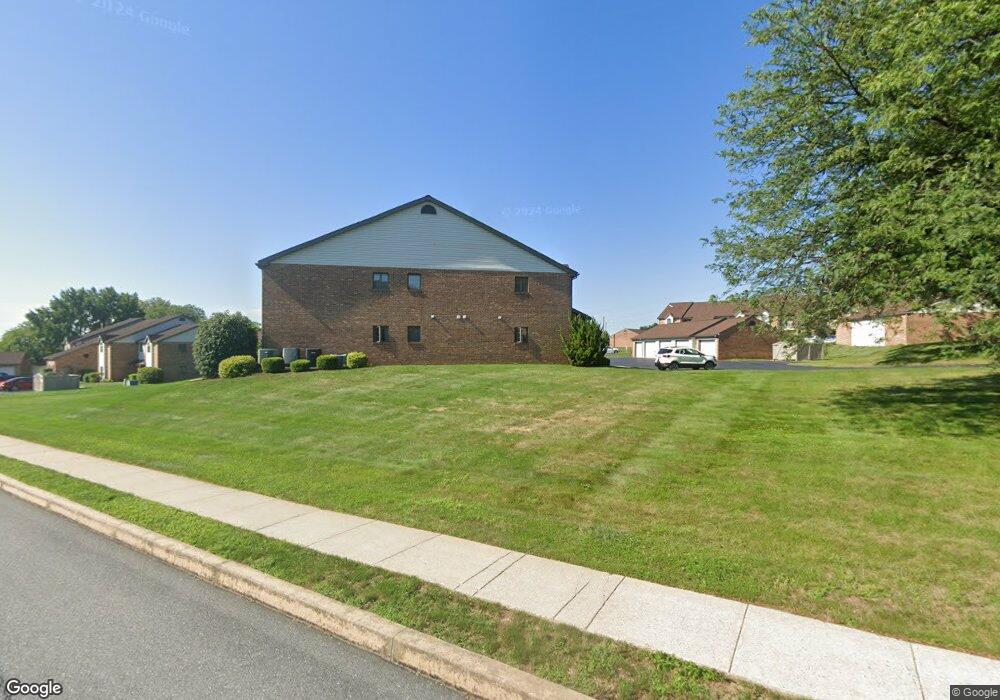
268 Black Oak Dr Unit 268 Lancaster, PA 17602
Fertility NeighborhoodEstimated Value: $231,000 - $247,000
2
Beds
2
Baths
1,361
Sq Ft
$176/Sq Ft
Est. Value
About This Home
This home is located at 268 Black Oak Dr Unit 268, Lancaster, PA 17602 and is currently estimated at $240,078, approximately $176 per square foot. 268 Black Oak Dr Unit 268 is a home located in Lancaster County with nearby schools including Fritz Elementary School, Gerald G. Huesken Middle School, and Conestoga Valley High School.
Ownership History
Date
Name
Owned For
Owner Type
Purchase Details
Closed on
Oct 20, 2005
Sold by
Plaisted William F
Bought by
Naumann Gena
Current Estimated Value
Home Financials for this Owner
Home Financials are based on the most recent Mortgage that was taken out on this home.
Original Mortgage
$88,900
Outstanding Balance
$47,853
Interest Rate
5.85%
Mortgage Type
Fannie Mae Freddie Mac
Estimated Equity
$192,225
Purchase Details
Closed on
Apr 25, 2000
Sold by
Hafner Susan M
Bought by
Underhill James R
Home Financials for this Owner
Home Financials are based on the most recent Mortgage that was taken out on this home.
Original Mortgage
$66,400
Interest Rate
8.26%
Purchase Details
Closed on
Apr 14, 2000
Sold by
Hafner Susan M and Hafner Susan N
Bought by
Plaisted William F
Home Financials for this Owner
Home Financials are based on the most recent Mortgage that was taken out on this home.
Original Mortgage
$66,400
Interest Rate
8.26%
Create a Home Valuation Report for This Property
The Home Valuation Report is an in-depth analysis detailing your home's value as well as a comparison with similar homes in the area
Home Values in the Area
Average Home Value in this Area
Purchase History
| Date | Buyer | Sale Price | Title Company |
|---|---|---|---|
| Naumann Gena | $131,900 | None Available | |
| Underhill James R | $7,000 | -- | |
| Plaisted William F | $83,000 | -- |
Source: Public Records
Mortgage History
| Date | Status | Borrower | Loan Amount |
|---|---|---|---|
| Open | Naumann Gena | $88,900 | |
| Previous Owner | Plaisted William F | $66,400 |
Source: Public Records
Tax History Compared to Growth
Tax History
| Year | Tax Paid | Tax Assessment Tax Assessment Total Assessment is a certain percentage of the fair market value that is determined by local assessors to be the total taxable value of land and additions on the property. | Land | Improvement |
|---|---|---|---|---|
| 2025 | $2,705 | $133,600 | -- | $133,600 |
| 2024 | $2,705 | $133,600 | -- | $133,600 |
| 2023 | $2,642 | $133,600 | $0 | $133,600 |
| 2022 | $2,576 | $133,600 | $0 | $133,600 |
| 2021 | $2,486 | $133,600 | $0 | $133,600 |
| 2020 | $2,486 | $133,600 | $0 | $133,600 |
| 2019 | $2,432 | $133,600 | $0 | $133,600 |
| 2018 | $3,579 | $133,600 | $0 | $133,600 |
| 2017 | $2,059 | $95,100 | $0 | $95,100 |
| 2016 | $2,034 | $95,100 | $0 | $95,100 |
| 2015 | $520 | $95,100 | $0 | $95,100 |
| 2014 | $1,411 | $95,100 | $0 | $95,100 |
Source: Public Records
Map
Nearby Homes
- 37 Black Oak Dr
- 71 Black Oak Dr Unit 71
- 35 Strasburg Pike
- 25 Homestead Dr
- 92 Glendale Dr
- 455 Garland Cir
- 1838 Fritz Ln
- 1827 Krystle Dr
- 129 S Eastland Dr
- 2 Upper Green
- 26 Upper Green
- 2 Resch Ln
- 502 Country Meadows Dr
- 1886 Conard Rd
- 257 Longfellow Dr
- 2315 Old Philadelphia Pike
- 1742 Old Philadelphia Pike
- 166 Huntingwood Dr
- 1817 Shelley Rd
- 822 Gail Place
- 266 Black Oak Dr
- 264 Black Oak Dr
- 264 Black Oak Dr
- 262 Black Oak Dr Unit 262
- 260 Black Oak Dr
- 260 Black Oak Dr Unit 260
- 260 Black Oak Dr Unit 260
- 258 Black Oak Dr Unit 258
- 258 Black Oak Dr
- 256 Black Oak Dr
- 254 Black Oak Dr
- 254 Black Oak Dr
- 254 Black Oak Dr
- 250 Black Oak Dr
- 24 Black Oak Dr
- 24 Black Oak Dr Unit 24
- 248 Black Oak Dr
- 248 Black Oak Dr
- 202 Black Oak Dr Unit 202
- 206 Black Oak Dr