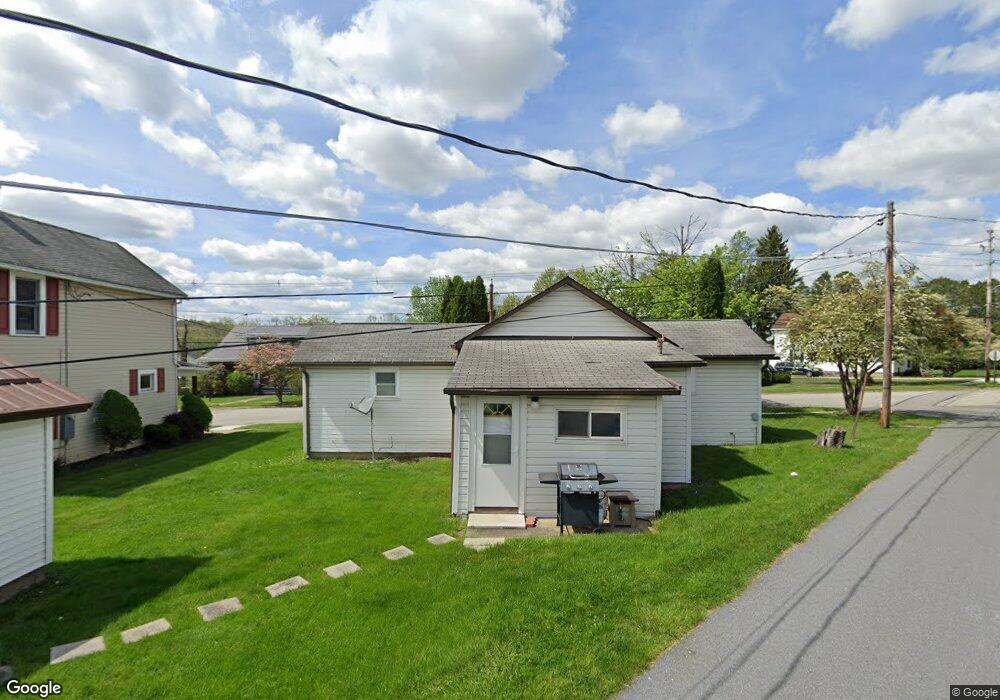
268 E Church St Homer City, PA 15748
Estimated Value: $81,000 - $116,000
2
Beds
1
Bath
992
Sq Ft
$100/Sq Ft
Est. Value
About This Home
This home is located at 268 E Church St, Homer City, PA 15748 and is currently estimated at $99,142, approximately $99 per square foot. 268 E Church St is a home located in Indiana County with nearby schools including Homer-Center Elementary School and Homer-Center Junior/Senior High School.
Ownership History
Date
Name
Owned For
Owner Type
Purchase Details
Closed on
Mar 2, 2020
Sold by
Taddie Timothy C and Taddie Cheryl R
Bought by
Lovejoy Katie B
Current Estimated Value
Home Financials for this Owner
Home Financials are based on the most recent Mortgage that was taken out on this home.
Original Mortgage
$33,000
Outstanding Balance
$29,281
Interest Rate
3.6%
Mortgage Type
Unknown
Estimated Equity
$69,861
Purchase Details
Closed on
Nov 16, 2012
Sold by
Yackuboskey Daniel and Yackuboskey Annette
Bought by
Taddie Timothy and Taddie Cheryl
Create a Home Valuation Report for This Property
The Home Valuation Report is an in-depth analysis detailing your home's value as well as a comparison with similar homes in the area
Home Values in the Area
Average Home Value in this Area
Purchase History
| Date | Buyer | Sale Price | Title Company |
|---|---|---|---|
| Lovejoy Katie B | $36,000 | None Available | |
| Taddie Timothy | $35,000 | None Available |
Source: Public Records
Mortgage History
| Date | Status | Borrower | Loan Amount |
|---|---|---|---|
| Open | Lovejoy Katie B | $33,000 |
Source: Public Records
Tax History Compared to Growth
Tax History
| Year | Tax Paid | Tax Assessment Tax Assessment Total Assessment is a certain percentage of the fair market value that is determined by local assessors to be the total taxable value of land and additions on the property. | Land | Improvement |
|---|---|---|---|---|
| 2025 | $1,266 | $45,000 | $9,600 | $35,400 |
| 2024 | $1,248 | $45,000 | $9,600 | $35,400 |
| 2023 | $1,182 | $45,000 | $9,600 | $35,400 |
| 2022 | $1,129 | $45,000 | $9,600 | $35,400 |
| 2021 | $1,129 | $45,000 | $9,600 | $35,400 |
| 2020 | $1,108 | $45,000 | $9,600 | $35,400 |
| 2018 | $1,102 | $45,000 | $9,600 | $35,400 |
| 2017 | $1,107 | $45,000 | $9,600 | $35,400 |
| 2016 | -- | $45,000 | $9,600 | $35,400 |
| 2015 | -- | $5,070 | $790 | $4,280 |
| 2014 | -- | $5,070 | $790 | $4,280 |
Source: Public Records
Map
Nearby Homes