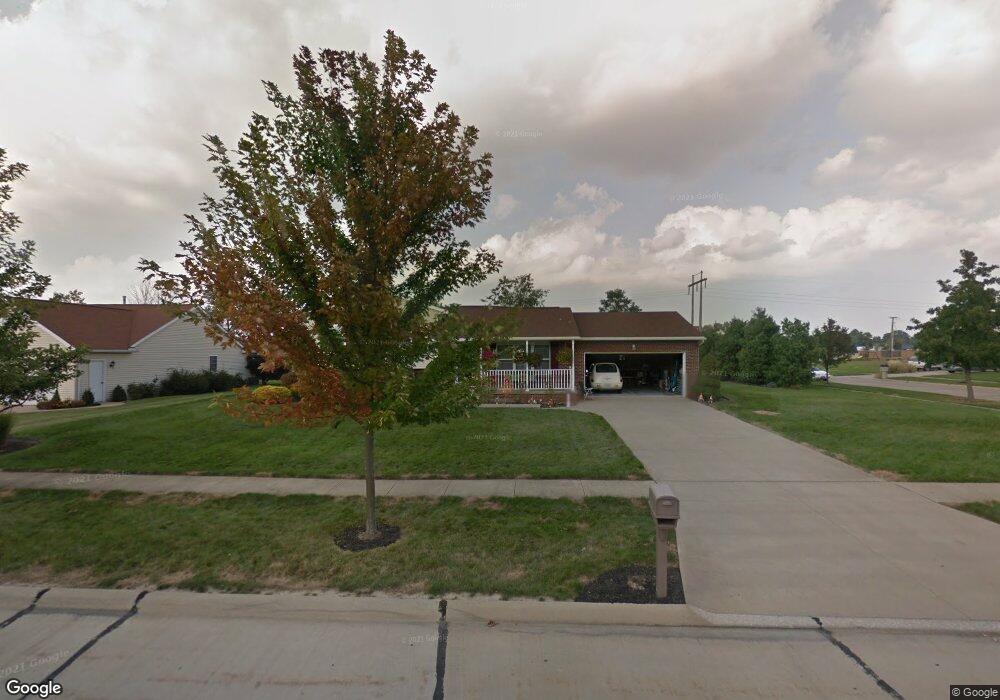
268 Greenview Ct Wellington, OH 44090
Estimated Value: $293,000 - $331,000
3
Beds
2
Baths
2,000
Sq Ft
$156/Sq Ft
Est. Value
About This Home
This home is located at 268 Greenview Ct, Wellington, OH 44090 and is currently estimated at $312,269, approximately $156 per square foot. 268 Greenview Ct is a home located in Lorain County with nearby schools including Westwood Elementary School, McCormick Middle School, and Wellington High School.
Ownership History
Date
Name
Owned For
Owner Type
Purchase Details
Closed on
Mar 24, 2010
Sold by
Ruple Michael J and Ruple Amy C
Bought by
Eutsler Stanley R and Eutsler Kathleen A
Current Estimated Value
Purchase Details
Closed on
May 16, 2001
Sold by
Bradley Development Co Inc
Bought by
Ruple Michael J and Ruple Amy C
Home Financials for this Owner
Home Financials are based on the most recent Mortgage that was taken out on this home.
Original Mortgage
$125,500
Interest Rate
7.02%
Mortgage Type
Construction
Purchase Details
Closed on
Nov 1, 2000
Sold by
Park Avenue Builders Inc
Bought by
Bradley Development Co Inc
Home Financials for this Owner
Home Financials are based on the most recent Mortgage that was taken out on this home.
Original Mortgage
$180,953
Interest Rate
7.96%
Create a Home Valuation Report for This Property
The Home Valuation Report is an in-depth analysis detailing your home's value as well as a comparison with similar homes in the area
Home Values in the Area
Average Home Value in this Area
Purchase History
| Date | Buyer | Sale Price | Title Company |
|---|---|---|---|
| Eutsler Stanley R | $148,500 | None Available | |
| Ruple Michael J | $27,500 | Silver Oak Title Agency Inc | |
| Bradley Development Co Inc | $181,000 | Midland Title |
Source: Public Records
Mortgage History
| Date | Status | Borrower | Loan Amount |
|---|---|---|---|
| Previous Owner | Ruple Michael J | $125,500 | |
| Previous Owner | Bradley Development Co Inc | $180,953 |
Source: Public Records
Tax History Compared to Growth
Tax History
| Year | Tax Paid | Tax Assessment Tax Assessment Total Assessment is a certain percentage of the fair market value that is determined by local assessors to be the total taxable value of land and additions on the property. | Land | Improvement |
|---|---|---|---|---|
| 2024 | $3,152 | $86,674 | $12,845 | $73,829 |
| 2023 | $2,243 | $58,006 | $11,732 | $46,274 |
| 2022 | $2,235 | $58,006 | $11,732 | $46,274 |
| 2021 | $2,237 | $58,006 | $11,732 | $46,274 |
| 2020 | $2,027 | $50,320 | $10,180 | $40,140 |
| 2019 | $1,993 | $50,320 | $10,180 | $40,140 |
| 2018 | $1,909 | $50,320 | $10,180 | $40,140 |
| 2017 | $1,818 | $43,910 | $9,130 | $34,780 |
| 2016 | $1,818 | $43,910 | $9,130 | $34,780 |
| 2015 | $1,815 | $43,910 | $9,130 | $34,780 |
| 2014 | $2,252 | $51,530 | $10,710 | $40,820 |
| 2013 | $2,249 | $51,530 | $10,710 | $40,820 |
Source: Public Records
Map
Nearby Homes
- 238 Reserve Cir
- 428 Prospect St
- 220 Woodland St
- 508 Courtland St
- 292 Grand Ave
- 123 Dickson St
- 111 S Mill St
- 207 Grand Ave
- 120 Hale St
- 513 E Herrick Ave
- 115 Vine St
- 112 Vine St
- 400 Barker St
- 21251 Pitts Rd
- 805 Regent Ct
- 25670 State Route 58
- 25600 Mcmillan Rd
- 43983 State Route 18
- 0 Peck Wadsworth Rd
- 20765 Quarry Rd
- 278 Greenview Ct
- 286 Greenview Ct
- 91 Greenview Ct
- 677 Parkside Reserve St
- 669 Parkside Reserve St
- 271 Greenview Ct
- 281 Greenview Ct
- 685 Parkside Reserve St
- 294 Greenview Ct
- 289 Greenview Ct
- 693 Parkside Reserve St
- 640 Parkside Reserve St
- 297 Greenview Ct
- 302 Greenview Ct
- 701 Parkside Reserve St
- 268 Lakeside Ave
- 278 Lakeside Ave
- 645 Parkside Reserve St
- 711 Parkside Reserve St
- 305 Greenview Ct