Estimated Value: $214,000 - $259,724
--
Bed
2
Baths
1,182
Sq Ft
$197/Sq Ft
Est. Value
About This Home
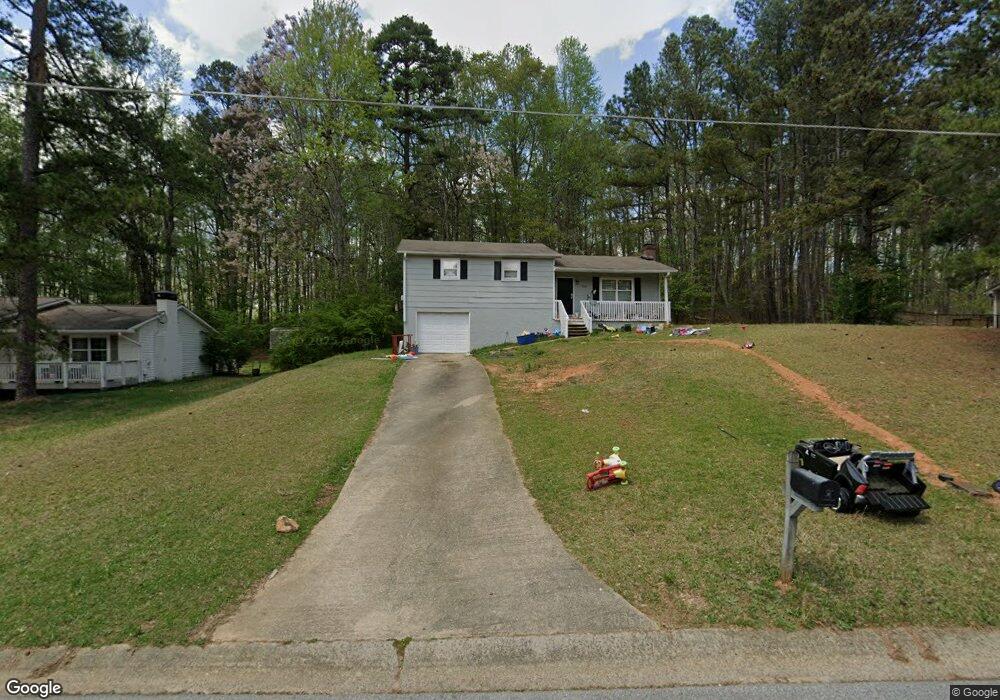
This home is located at 268 Hardy Way, Hiram, GA 30141 and is currently estimated at $232,681, approximately $196 per square foot. 268 Hardy Way is a home located in Paulding County with nearby schools including Hiram Elementary School, P. B. Ritch Middle School, and Hiram High School.
Ownership History
Date
Name
Owned For
Owner Type
Purchase Details
Closed on
Mar 11, 2015
Sold by
Equity Trust Co Custodian Fbo
Bought by
Rha 1 Llc
Current Estimated Value
Purchase Details
Closed on
Aug 13, 2014
Sold by
Federal National Mtg Associati
Bought by
Equity Trust Co Custodian Fbo and Smith Myra Susan Ira
Purchase Details
Closed on
May 6, 2014
Sold by
Nationstar Mtg Llc
Bought by
Federal National Mtg Associati
Purchase Details
Closed on
May 30, 2007
Sold by
Hud-Housing Of Urban Dev
Bought by
Jerauld John M
Home Financials for this Owner
Home Financials are based on the most recent Mortgage that was taken out on this home.
Original Mortgage
$57,600
Interest Rate
6.12%
Mortgage Type
New Conventional
Purchase Details
Closed on
Sep 6, 2005
Sold by
Georgia Hsng Finl Authority
Bought by
Secretary Of Hud
Create a Home Valuation Report for This Property
The Home Valuation Report is an in-depth analysis detailing your home's value as well as a comparison with similar homes in the area
Home Values in the Area
Average Home Value in this Area
Purchase History
| Date | Buyer | Sale Price | Title Company |
|---|---|---|---|
| Rha 1 Llc | $76,500 | -- | |
| Equity Trust Co Custodian Fbo | $42,500 | -- | |
| Federal National Mtg Associati | $46,600 | -- | |
| Nationstar Mtg Llc | $46,600 | -- | |
| Jerauld John M | -- | -- | |
| Secretary Of Hud | -- | -- | |
| Georgia Hsng Finl Authority | $57,576 | -- |
Source: Public Records
Mortgage History
| Date | Status | Borrower | Loan Amount |
|---|---|---|---|
| Previous Owner | Jerauld John M | $57,600 |
Source: Public Records
Tax History Compared to Growth
Tax History
| Year | Tax Paid | Tax Assessment Tax Assessment Total Assessment is a certain percentage of the fair market value that is determined by local assessors to be the total taxable value of land and additions on the property. | Land | Improvement |
|---|---|---|---|---|
| 2024 | $2,193 | $88,160 | $12,000 | $76,160 |
| 2023 | $2,370 | $90,928 | $12,000 | $78,928 |
| 2022 | $2,074 | $69,820 | $12,000 | $57,820 |
| 2021 | $1,431 | $48,168 | $6,000 | $42,168 |
| 2020 | $1,533 | $51,632 | $6,000 | $45,632 |
| 2019 | $1,284 | $42,604 | $6,000 | $36,604 |
| 2018 | $1,289 | $42,784 | $6,000 | $36,784 |
| 2017 | $1,027 | $33,624 | $6,000 | $27,624 |
| 2016 | $899 | $29,740 | $6,000 | $23,740 |
| 2015 | $523 | $17,148 | $6,000 | $11,148 |
| 2014 | $524 | $16,608 | $6,000 | $10,608 |
| 2013 | -- | $13,400 | $6,000 | $7,400 |
Source: Public Records
Map
Nearby Homes
- 146 Rosemont Ct
- 00 Highland
- 386 Hill Crest Cir
- 304 Greystone Pkwy
- 536 Highland Falls Dr
- 209 Enterprise Path
- 0 Highway 278 NE Unit 10338401
- 194 Prospect Path
- 00 Highland Pavilion Ct
- 0 Old Mill Rd Unit 7632177
- 0 Old Mill Rd Unit 10569938
- 310 Bill Carruth Pkwy
- 52 Darbys Run Way
- 24 Darbys Run Way
- 9 Darbys Run Way
- 000 Us Highway 278
- 25 Derby Dr
- 98 Pace Dr
- 150 Hiram Terrace
- 14 Berkten Ct