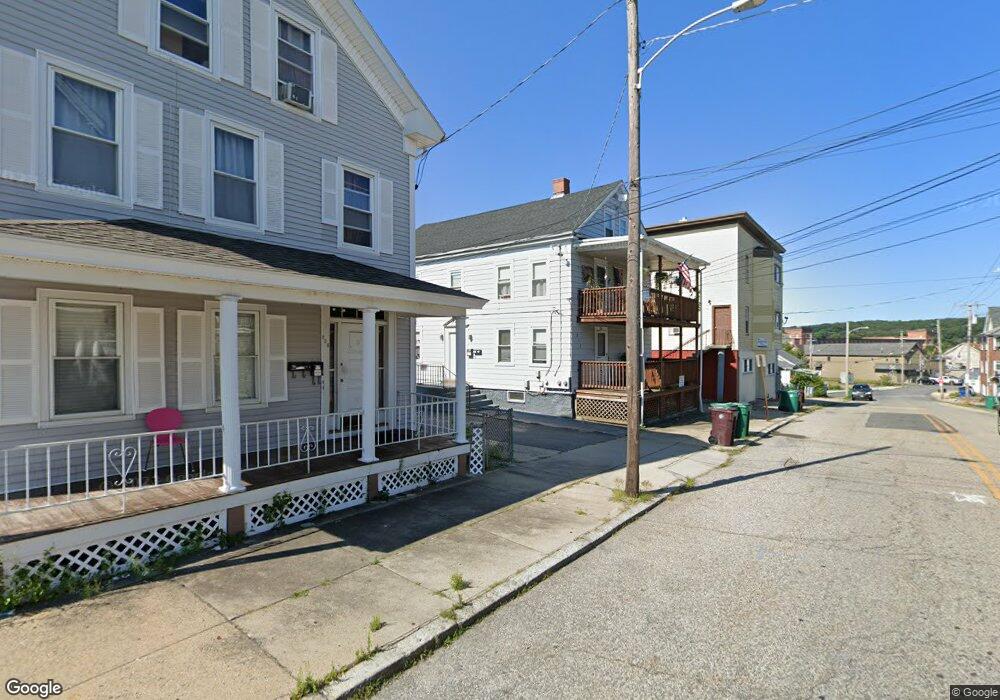
268 High St Woonsocket, RI 02895
Downtown Woonsocket NeighborhoodEstimated Value: $391,940 - $454,000
6
Beds
2
Baths
2,064
Sq Ft
$206/Sq Ft
Est. Value
About This Home
This home is located at 268 High St, Woonsocket, RI 02895 and is currently estimated at $425,735, approximately $206 per square foot. 268 High St is a home located in Providence County with nearby schools including Woonsocket High School, Rise Prep Mayoral Academy Middle School, and Rise Prep Mayoral Academy.
Ownership History
Date
Name
Owned For
Owner Type
Purchase Details
Closed on
Aug 20, 2018
Sold by
Paul A Latraverse Jr T A and Paul Latraverse
Bought by
Johnson Brothers Ri Rl
Current Estimated Value
Home Financials for this Owner
Home Financials are based on the most recent Mortgage that was taken out on this home.
Original Mortgage
$600,000
Outstanding Balance
$516,707
Interest Rate
4.5%
Mortgage Type
Purchase Money Mortgage
Estimated Equity
-$90,972
Purchase Details
Closed on
Feb 10, 1997
Sold by
Ford Consumer Finance
Bought by
Latraverse Paul A
Home Financials for this Owner
Home Financials are based on the most recent Mortgage that was taken out on this home.
Original Mortgage
$31,000
Interest Rate
7.57%
Mortgage Type
Purchase Money Mortgage
Create a Home Valuation Report for This Property
The Home Valuation Report is an in-depth analysis detailing your home's value as well as a comparison with similar homes in the area
Home Values in the Area
Average Home Value in this Area
Purchase History
| Date | Buyer | Sale Price | Title Company |
|---|---|---|---|
| Johnson Brothers Ri Rl | -- | -- | |
| Johnson Brothers Ri Rl | -- | -- | |
| Latraverse Paul A | $31,000 | -- | |
| Latraverse Paul A | $31,000 | -- |
Source: Public Records
Mortgage History
| Date | Status | Borrower | Loan Amount |
|---|---|---|---|
| Open | Johnson Brothers Ri Rl | $600,000 | |
| Open | Johnson Brothers Ri Rl | $2,946,000 | |
| Closed | Latraverse Paul A | $600,000 | |
| Closed | Latraverse Paul A | $2,946,000 | |
| Previous Owner | Latraverse Paul A | $24,000 | |
| Previous Owner | Latraverse Paul A | $31,000 |
Source: Public Records
Tax History
| Year | Tax Paid | Tax Assessment Tax Assessment Total Assessment is a certain percentage of the fair market value that is determined by local assessors to be the total taxable value of land and additions on the property. | Land | Improvement |
|---|---|---|---|---|
| 2025 | $4,089 | $364,100 | $89,000 | $275,100 |
| 2024 | $3,798 | $261,200 | $90,600 | $170,600 |
| 2023 | $3,652 | $261,200 | $90,600 | $170,600 |
| 2022 | $3,652 | $261,200 | $90,600 | $170,600 |
| 2021 | $3,259 | $137,200 | $36,700 | $100,500 |
| 2020 | $3,293 | $137,200 | $36,700 | $100,500 |
| 2018 | $3,304 | $137,200 | $36,700 | $100,500 |
| 2017 | $3,600 | $119,600 | $40,400 | $79,200 |
| 2016 | $3,808 | $119,600 | $40,400 | $79,200 |
| 2015 | $4,375 | $119,600 | $40,400 | $79,200 |
| 2014 | $4,255 | $118,400 | $44,500 | $73,900 |
Source: Public Records
Map
Nearby Homes
- 115 Railroad St
- 99 Cato St
- 36 Fairmount St
- 180 Allen St Unit 104
- 107 Blackstone St
- 0 N Main St Unit 1401765
- 120 East St
- 187 Boyden St
- 164 W School St
- 379 Front St
- 35 Greene St
- 0 Holbrook Ln Unit 1402850
- 154 156 Winter St
- 233 Grove St
- 217 4th Ave
- 123 4th Ave
- 83 4th Ave
- 42 Transit St
- 130 E School St
- 24 Paradis Ave
Your Personal Tour Guide
Ask me questions while you tour the home.