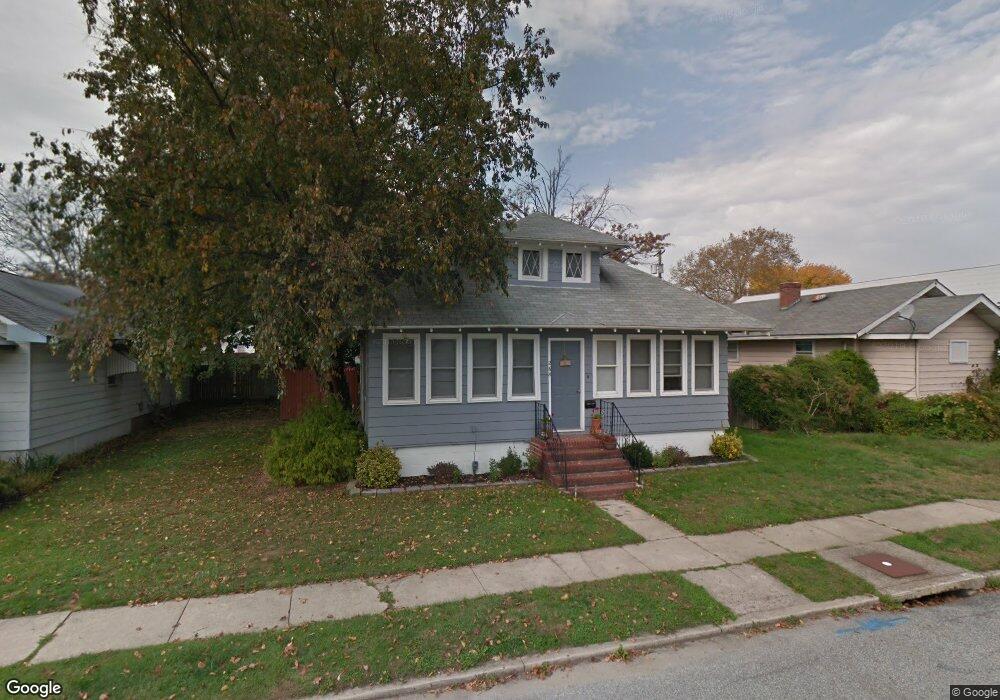
268 Johnson St Penns Grove, NJ 08069
Estimated Value: $161,601 - $184,000
--
Bed
--
Bath
680
Sq Ft
$258/Sq Ft
Est. Value
About This Home
This home is located at 268 Johnson St, Penns Grove, NJ 08069 and is currently estimated at $175,650, approximately $258 per square foot. 268 Johnson St is a home located in Salem County with nearby schools including Lafayette-Pershing Elementary School, Paul W. Carleton Elementary School, and Field Street Elementary School.
Ownership History
Date
Name
Owned For
Owner Type
Purchase Details
Closed on
Apr 26, 2000
Sold by
Haigh Gay L and Delbuono Gay L
Bought by
Durham Barbara
Current Estimated Value
Home Financials for this Owner
Home Financials are based on the most recent Mortgage that was taken out on this home.
Original Mortgage
$49,980
Outstanding Balance
$17,354
Interest Rate
8.21%
Mortgage Type
VA
Estimated Equity
$158,296
Purchase Details
Closed on
Apr 21, 2000
Sold by
Strain Janelee and Lapp Janelee
Bought by
Haigh Gay L
Home Financials for this Owner
Home Financials are based on the most recent Mortgage that was taken out on this home.
Original Mortgage
$49,980
Outstanding Balance
$17,354
Interest Rate
8.21%
Mortgage Type
VA
Estimated Equity
$158,296
Create a Home Valuation Report for This Property
The Home Valuation Report is an in-depth analysis detailing your home's value as well as a comparison with similar homes in the area
Home Values in the Area
Average Home Value in this Area
Purchase History
| Date | Buyer | Sale Price | Title Company |
|---|---|---|---|
| Durham Barbara | $49,000 | Heritage Title & Abstract Ag | |
| Haigh Gay L | -- | Continental Title Abstract C |
Source: Public Records
Mortgage History
| Date | Status | Borrower | Loan Amount |
|---|---|---|---|
| Open | Durham Barbara | $49,980 |
Source: Public Records
Tax History Compared to Growth
Tax History
| Year | Tax Paid | Tax Assessment Tax Assessment Total Assessment is a certain percentage of the fair market value that is determined by local assessors to be the total taxable value of land and additions on the property. | Land | Improvement |
|---|---|---|---|---|
| 2025 | $2,910 | $164,800 | $38,400 | $126,400 |
| 2024 | $2,793 | $92,500 | $37,400 | $55,100 |
| 2023 | $2,793 | $92,500 | $37,400 | $55,100 |
| 2022 | $2,599 | $92,500 | $37,400 | $55,100 |
| 2021 | $2,352 | $92,500 | $37,400 | $55,100 |
| 2020 | $3,096 | $92,500 | $37,400 | $55,100 |
| 2019 | $3,122 | $92,500 | $37,400 | $55,100 |
| 2018 | $2,998 | $95,200 | $39,000 | $56,200 |
| 2017 | $2,795 | $95,200 | $39,000 | $56,200 |
| 2016 | $2,693 | $95,200 | $39,000 | $56,200 |
| 2015 | $3,228 | $119,700 | $46,000 | $73,700 |
| 2014 | $3,056 | $119,700 | $46,000 | $73,700 |
Source: Public Records
Map
Nearby Homes