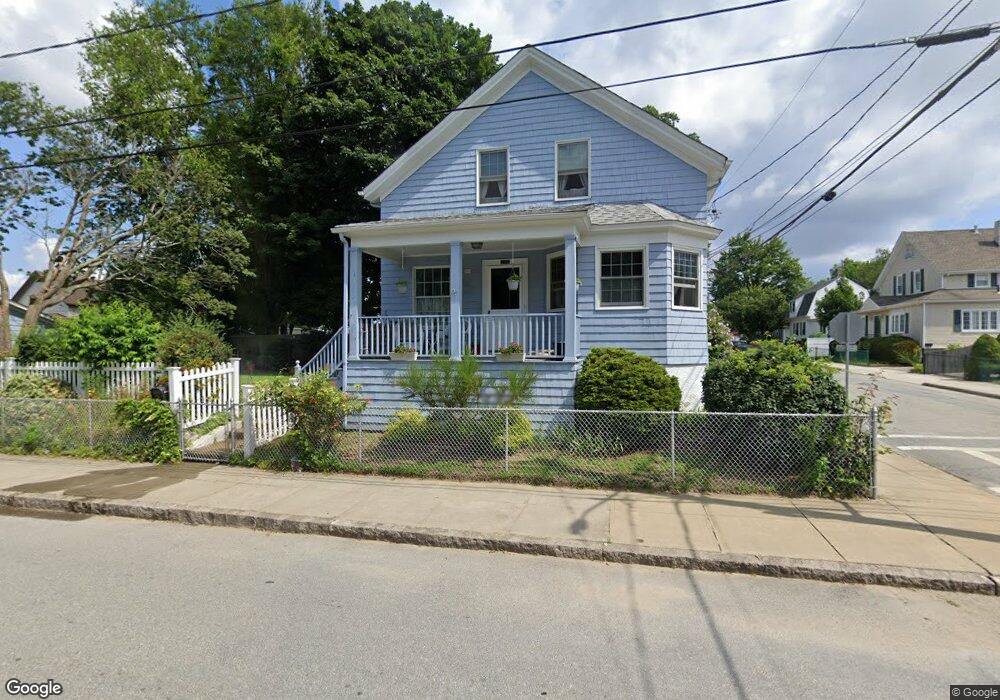
268 Lawton St Fall River, MA 02721
Maplewood NeighborhoodEstimated Value: $359,000 - $449,000
5
Beds
3
Baths
1,317
Sq Ft
$297/Sq Ft
Est. Value
About This Home
This home is located at 268 Lawton St, Fall River, MA 02721 and is currently estimated at $390,806, approximately $296 per square foot. 268 Lawton St is a home located in Bristol County with nearby schools including Letourneau Elementary School, Matthew J. Kuss Middle School, and B M C Durfee High School.
Ownership History
Date
Name
Owned For
Owner Type
Purchase Details
Closed on
Jun 21, 2012
Sold by
Borges Ralph S and Borges Barbara A
Bought by
Borges Robin M and Borges Carleen A
Current Estimated Value
Purchase Details
Closed on
Oct 14, 1965
Bought by
Borges Robin M and Borges Carleen A
Create a Home Valuation Report for This Property
The Home Valuation Report is an in-depth analysis detailing your home's value as well as a comparison with similar homes in the area
Home Values in the Area
Average Home Value in this Area
Purchase History
| Date | Buyer | Sale Price | Title Company |
|---|---|---|---|
| Borges Robin M | -- | -- | |
| Borges Robin M | -- | -- |
Source: Public Records
Mortgage History
| Date | Status | Borrower | Loan Amount |
|---|---|---|---|
| Previous Owner | Borges Robin M | $125,000 | |
| Previous Owner | Borges Robin M | $40,000 | |
| Previous Owner | Borges Robin M | $30,000 | |
| Previous Owner | Borges Robin M | $45,000 |
Source: Public Records
Tax History Compared to Growth
Tax History
| Year | Tax Paid | Tax Assessment Tax Assessment Total Assessment is a certain percentage of the fair market value that is determined by local assessors to be the total taxable value of land and additions on the property. | Land | Improvement |
|---|---|---|---|---|
| 2025 | $3,595 | $314,000 | $124,800 | $189,200 |
| 2024 | $3,400 | $295,900 | $120,000 | $175,900 |
| 2023 | $3,187 | $259,700 | $102,900 | $156,800 |
| 2022 | $2,948 | $233,600 | $93,500 | $140,100 |
| 2021 | $2,756 | $199,300 | $86,600 | $112,700 |
| 2020 | $2,759 | $190,900 | $82,800 | $108,100 |
| 2019 | $2,645 | $181,400 | $78,900 | $102,500 |
| 2018 | $2,496 | $170,700 | $77,400 | $93,300 |
| 2017 | $2,401 | $171,500 | $79,000 | $92,500 |
| 2016 | $2,323 | $170,400 | $82,300 | $88,100 |
| 2015 | $2,148 | $164,200 | $79,200 | $85,000 |
| 2014 | $2,118 | $168,400 | $83,400 | $85,000 |
Source: Public Records
Map
Nearby Homes
- 415 Anthony St
- 125 Carl St
- 478 Tucker St
- 1441 Stafford Rd
- 539 Aetna St
- 59 Wayne St
- 256 Rhode Island Ave
- 59 Denver St
- 228 Dickinson St
- 495 Chicago St
- 1553 Rodman St
- 217 Napoleon St
- 80 Lane St
- 323 S Oxford St
- 191 Glasgow St Unit 2
- 191 Glasgow St Unit 1
- 239 Glasgow St Unit 8
- 352 Vale St Unit 1
- 185 Stevens St
- 340 Vale St