268 Main St Groveland, MA 01834
Estimated Value: $746,000 - $784,000
4
Beds
1
Bath
2,156
Sq Ft
$357/Sq Ft
Est. Value
About This Home
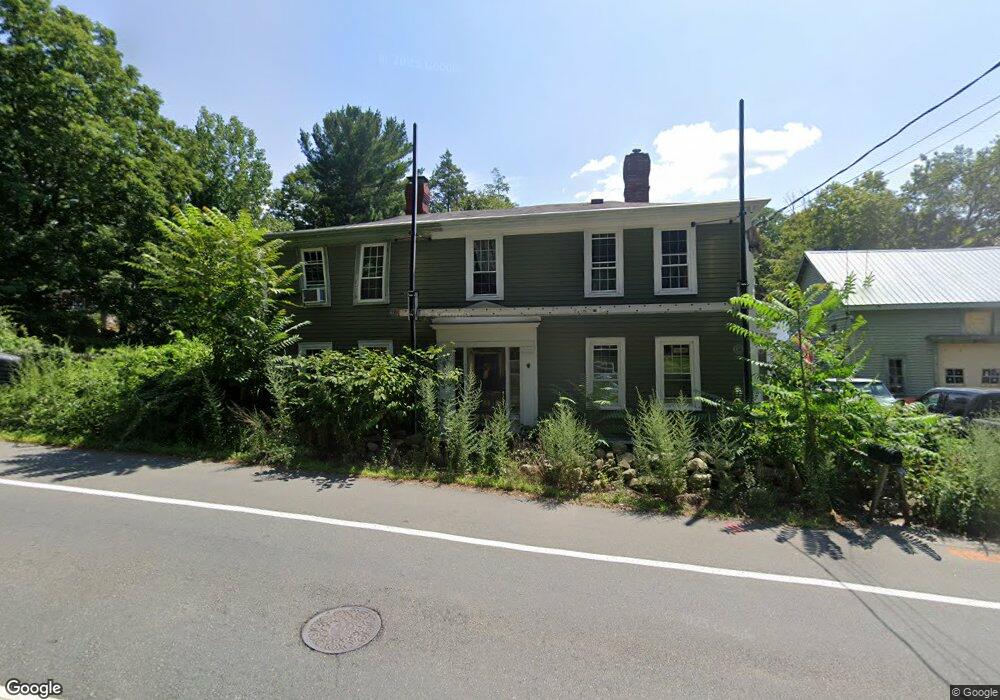
This home is located at 268 Main St, Groveland, MA 01834 and is currently estimated at $769,660, approximately $356 per square foot. 268 Main St is a home located in Essex County with nearby schools including Pentucket Regional High School.
Ownership History
Date
Name
Owned For
Owner Type
Purchase Details
Closed on
Jun 1, 2004
Sold by
Sullivan Frances W
Bought by
Deschenes Charles E
Current Estimated Value
Home Financials for this Owner
Home Financials are based on the most recent Mortgage that was taken out on this home.
Original Mortgage
$304,000
Outstanding Balance
$147,409
Interest Rate
5.88%
Mortgage Type
Purchase Money Mortgage
Estimated Equity
$622,251
Create a Home Valuation Report for This Property
The Home Valuation Report is an in-depth analysis detailing your home's value as well as a comparison with similar homes in the area
Home Values in the Area
Average Home Value in this Area
Purchase History
| Date | Buyer | Sale Price | Title Company |
|---|---|---|---|
| Deschenes Charles E | $380,000 | -- |
Source: Public Records
Mortgage History
| Date | Status | Borrower | Loan Amount |
|---|---|---|---|
| Open | Deschenes Charles E | $304,000 | |
| Closed | Deschenes Charles E | $57,000 |
Source: Public Records
Tax History Compared to Growth
Tax History
| Year | Tax Paid | Tax Assessment Tax Assessment Total Assessment is a certain percentage of the fair market value that is determined by local assessors to be the total taxable value of land and additions on the property. | Land | Improvement |
|---|---|---|---|---|
| 2025 | $8,609 | $678,400 | $209,100 | $469,300 |
| 2024 | $7,741 | $571,700 | $206,900 | $364,800 |
| 2023 | $7,355 | $560,200 | $213,400 | $346,800 |
| 2022 | $7,174 | $495,800 | $187,300 | $308,500 |
| 2021 | $6,715 | $456,200 | $165,500 | $290,700 |
| 2020 | $5,803 | $413,000 | $150,300 | $262,700 |
| 2019 | $5,664 | $394,700 | $145,900 | $248,800 |
| 2018 | $5,343 | $363,700 | $132,900 | $230,800 |
| 2017 | $5,934 | $404,200 | $132,900 | $271,300 |
| 2016 | $5,719 | $379,000 | $126,300 | $252,700 |
| 2015 | $5,067 | $346,800 | $98,000 | $248,800 |
| 2014 | $4,776 | $317,100 | $98,000 | $219,100 |
Source: Public Records
Map
Nearby Homes
- 47 Gardner St
- 28 Coffin Ave
- 20 Francis Ave
- 144 Old Ferry Rd Unit H
- 19 Orchard Ave Unit F
- 358 Main St
- 23 Orchard Ave Unit E
- 18-1/2 Cannon Hill Ave
- 3 Marjorie St
- 33 Groveland Commons Way
- 7 Marjorie St
- 404 Main St
- 106 School St
- 63 Old Ferry Rd
- 49 Douglas St
- 425 Main St
- 280 E Broadway
- 98 King St
- 100 King St
- 10 Carlida Rd