Estimated Value: $425,000 - $545,000
4
Beds
3
Baths
2,379
Sq Ft
$202/Sq Ft
Est. Value
About This Home
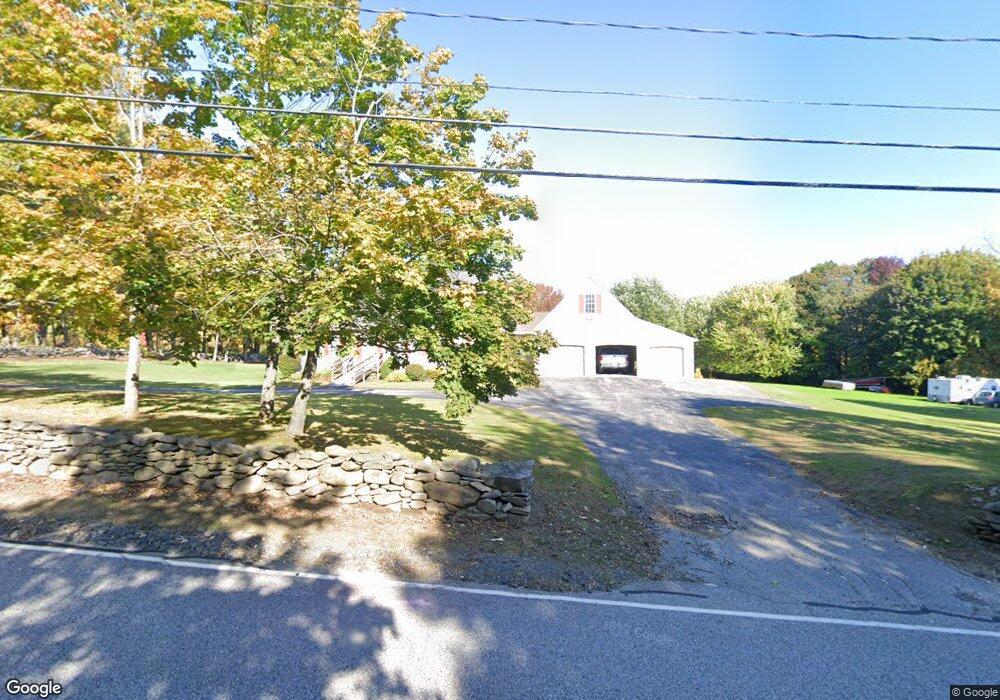
This home is located at 268 Pleasant St, Barre, MA 01005 and is currently estimated at $480,086, approximately $201 per square foot. 268 Pleasant St is a home located in Worcester County with nearby schools including Quabbin Regional Middle School and Quabbin Regional High School.
Ownership History
Date
Name
Owned For
Owner Type
Purchase Details
Closed on
May 7, 2024
Sold by
Flynn Vernon M
Bought by
Vernon M Flynn Iii Ft and Flynn
Current Estimated Value
Purchase Details
Closed on
Dec 6, 2013
Sold by
Vaidulas Flynn B and Vaidulas Merle O
Bought by
B Peter Regienus Lt and Regienus
Purchase Details
Closed on
Nov 12, 2009
Sold by
Flynn B Ramona
Bought by
Flynn B Ramona B and Flynn Vernon M
Purchase Details
Closed on
Mar 4, 2008
Sold by
Vaidulas Merle O
Bought by
Vaidulas Flynn B and Vaidulas Merle O
Create a Home Valuation Report for This Property
The Home Valuation Report is an in-depth analysis detailing your home's value as well as a comparison with similar homes in the area
Home Values in the Area
Average Home Value in this Area
Purchase History
| Date | Buyer | Sale Price | Title Company |
|---|---|---|---|
| Vernon M Flynn Iii Ft | -- | None Available | |
| Vernon M Flynn Iii Ft | -- | None Available | |
| Vernon M Flynn Iii Ft | -- | None Available | |
| B Peter Regienus Lt | $45,000 | -- | |
| B Peter Regienus Lt | $45,000 | -- | |
| Flynn B Ramona B | -- | -- | |
| Flynn B Ramona B | -- | -- | |
| Vaidulas Flynn B | -- | -- | |
| Vaidulas Flynn B | -- | -- |
Source: Public Records
Tax History
| Year | Tax Paid | Tax Assessment Tax Assessment Total Assessment is a certain percentage of the fair market value that is determined by local assessors to be the total taxable value of land and additions on the property. | Land | Improvement |
|---|---|---|---|---|
| 2025 | $6,738 | $495,800 | $69,600 | $426,200 |
| 2024 | $6,614 | $473,100 | $65,400 | $407,700 |
| 2023 | $6,320 | $398,500 | $53,400 | $345,100 |
| 2022 | $6,175 | $366,700 | $47,000 | $319,700 |
| 2021 | $5,978 | $332,100 | $47,000 | $285,100 |
| 2020 | $5,845 | $327,100 | $47,000 | $280,100 |
| 2019 | $5,755 | $317,600 | $43,000 | $274,600 |
| 2018 | $4,832 | $257,000 | $43,000 | $214,000 |
| 2017 | $4,587 | $245,300 | $43,000 | $202,300 |
| 2016 | $4,254 | $239,000 | $39,000 | $200,000 |
| 2015 | $4,328 | $232,200 | $48,200 | $184,000 |
| 2014 | $3,650 | $227,300 | $56,700 | $170,600 |
Source: Public Records
Map
Nearby Homes
Your Personal Tour Guide
Ask me questions while you tour the home.