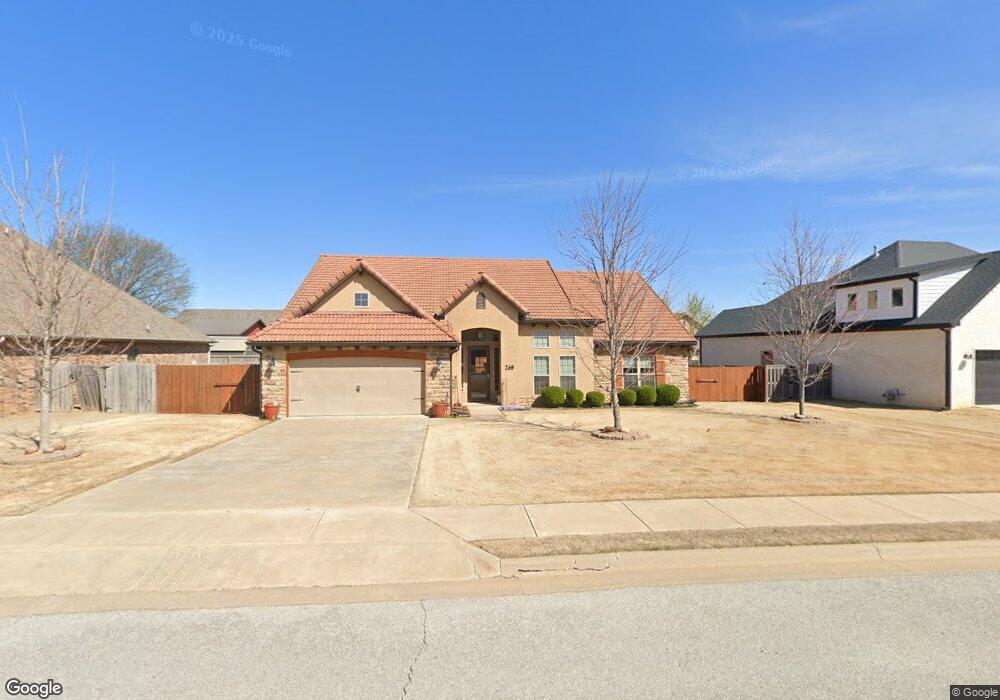
268 Ranalli Ave Tontitown, AR 72770
Estimated Value: $422,254 - $443,000
3
Beds
2
Baths
2,017
Sq Ft
$212/Sq Ft
Est. Value
About This Home
This home is located at 268 Ranalli Ave, Tontitown, AR 72770 and is currently estimated at $428,314, approximately $212 per square foot. 268 Ranalli Ave is a home located in Washington County with nearby schools including Jim D Rollins Elementary School of Innovation, Hellstern Middle School, and Central Junior High School.
Ownership History
Date
Name
Owned For
Owner Type
Purchase Details
Closed on
Aug 17, 2018
Sold by
Moore James Bradley and Moore Alexis Nichole
Bought by
Huggins Marvin E and Huggins Nelda Jan
Current Estimated Value
Purchase Details
Closed on
Dec 22, 2014
Sold by
Pearson Family Trust
Bought by
Moore James Bradley and Moore Alexia Nichole
Home Financials for this Owner
Home Financials are based on the most recent Mortgage that was taken out on this home.
Original Mortgage
$204,723
Interest Rate
4.04%
Mortgage Type
FHA
Purchase Details
Closed on
May 14, 2013
Sold by
Allied Bank
Bought by
Pearson Family Trust
Home Financials for this Owner
Home Financials are based on the most recent Mortgage that was taken out on this home.
Original Mortgage
$198,704
Interest Rate
3.56%
Mortgage Type
New Conventional
Purchase Details
Closed on
Jul 20, 2010
Sold by
Summit Construction Company
Bought by
Pearson Family Trust
Create a Home Valuation Report for This Property
The Home Valuation Report is an in-depth analysis detailing your home's value as well as a comparison with similar homes in the area
Home Values in the Area
Average Home Value in this Area
Purchase History
| Date | Buyer | Sale Price | Title Company |
|---|---|---|---|
| Huggins Marvin E | $246,750 | Waco Title Co | |
| Moore James Bradley | $208,500 | None Available | |
| Pearson Family Trust | $200,000 | None Available | |
| Pearson Family Trust | -- | None Available |
Source: Public Records
Mortgage History
| Date | Status | Borrower | Loan Amount |
|---|---|---|---|
| Previous Owner | Moore James Bradley | $204,723 | |
| Previous Owner | Pearson Family Trust | $198,704 |
Source: Public Records
Tax History Compared to Growth
Tax History
| Year | Tax Paid | Tax Assessment Tax Assessment Total Assessment is a certain percentage of the fair market value that is determined by local assessors to be the total taxable value of land and additions on the property. | Land | Improvement |
|---|---|---|---|---|
| 2025 | $1,586 | $76,150 | $16,000 | $60,150 |
| 2024 | $1,686 | $76,150 | $16,000 | $60,150 |
| 2023 | $1,814 | $76,150 | $16,000 | $60,150 |
| 2022 | $1,864 | $50,000 | $10,000 | $40,000 |
| 2021 | $1,864 | $50,000 | $10,000 | $40,000 |
| 2020 | $1,860 | $50,000 | $10,000 | $40,000 |
| 2019 | $1,864 | $44,340 | $7,700 | $36,640 |
| 2018 | $1,889 | $44,340 | $7,700 | $36,640 |
| 2017 | $1,845 | $44,340 | $7,700 | $36,640 |
| 2016 | $1,845 | $44,340 | $7,700 | $36,640 |
| 2015 | $1,845 | $44,340 | $7,700 | $36,640 |
| 2014 | $2,186 | $45,080 | $7,500 | $37,580 |
Source: Public Records
Map
Nearby Homes
- 452 Romano Ave
- 310 Ceola Ave
- 329 Ceola Ave
- 5558 Clear Springs Ave
- 881 Pergola
- 945 Pergola
- 662 Primitivo Ave
- 773 Via Firenze Ave
- 847 Via Firenze Ave
- 862 Via Firenze Ave
- 720 Via Sangro Rd
- 7832 Brooklyn Ave
- 695 Malbec Rd
- 294 Arlington Way
- 2360 Two Story Plan at Bariloche
- 2150-4 Plan at Bariloche
- 1550KP-4 Plan at Bariloche
- 2050 Plan at Bariloche
- 2000 Two Story Plan at Bariloche
- 1650 Plan at Bariloche
- 268 Ranalli Ave
- 252 Ranalli Ave
- 284 Ranalli Ave
- 285 Gaiche St
- 285 Gaiche St
- 269 Ranalli Ave
- 236 Ranalli Ave
- 253 Ranalli Ave
- 285 Ranalli Ave
- 269 Gaiche St
- 237 Ranalli Ave
- 316 Ranalli Ave
- 220 Ranalli Ave
- 317 Ranalli Ave
- 317 Correnti Ct
- 270 Penzo Ave
- 254 Penzo Ave
- 286 Penzo Ave
- 221 Ranalli Ave
- 253 Gaiche St