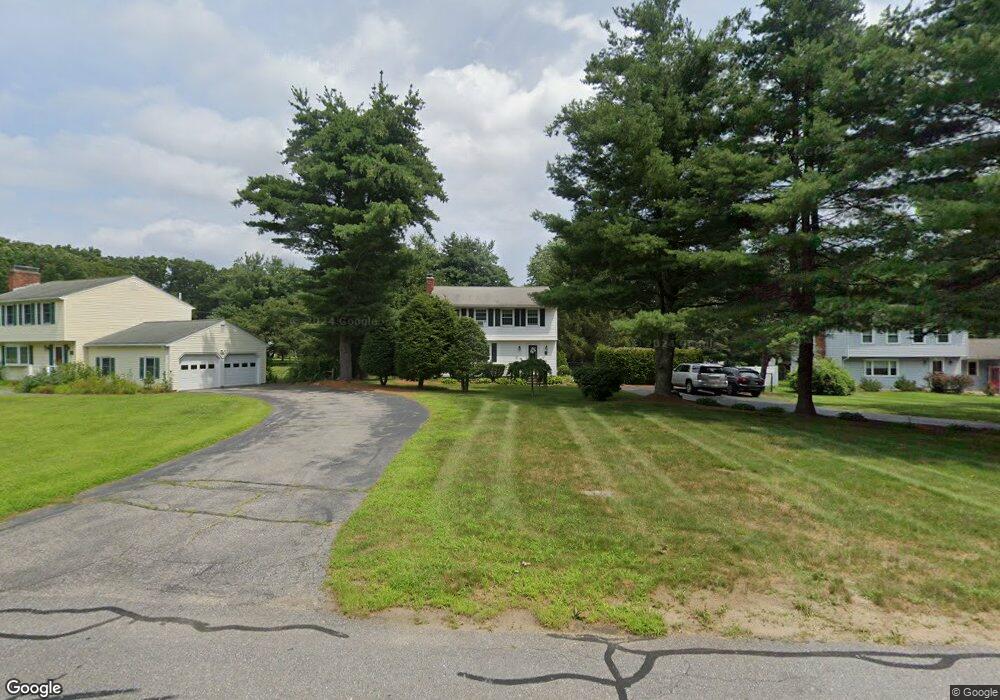
268 Rice Ave Northborough, MA 01532
Estimated Value: $595,923 - $704,000
4
Beds
2
Baths
1,470
Sq Ft
$440/Sq Ft
Est. Value
About This Home
This home is located at 268 Rice Ave, Northborough, MA 01532 and is currently estimated at $646,981, approximately $440 per square foot. 268 Rice Ave is a home located in Worcester County with nearby schools including Marion E. Zeh Elementary School, Robert E. Melican Middle School, and Algonquin Regional High School.
Ownership History
Date
Name
Owned For
Owner Type
Purchase Details
Closed on
Jan 14, 2021
Sold by
Ryan Scott M and Ryan Christine J
Bought by
Ryan Lt
Current Estimated Value
Purchase Details
Closed on
Jan 16, 2001
Sold by
Soucy Verna M
Bought by
Ryan Scott M and Ryan Christine J
Home Financials for this Owner
Home Financials are based on the most recent Mortgage that was taken out on this home.
Original Mortgage
$190,000
Interest Rate
7.64%
Mortgage Type
Purchase Money Mortgage
Create a Home Valuation Report for This Property
The Home Valuation Report is an in-depth analysis detailing your home's value as well as a comparison with similar homes in the area
Home Values in the Area
Average Home Value in this Area
Purchase History
| Date | Buyer | Sale Price | Title Company |
|---|---|---|---|
| Ryan Lt | -- | None Available | |
| Ryan Scott M | $265,000 | -- |
Source: Public Records
Mortgage History
| Date | Status | Borrower | Loan Amount |
|---|---|---|---|
| Previous Owner | Ryan Scott M | $190,000 |
Source: Public Records
Tax History Compared to Growth
Tax History
| Year | Tax Paid | Tax Assessment Tax Assessment Total Assessment is a certain percentage of the fair market value that is determined by local assessors to be the total taxable value of land and additions on the property. | Land | Improvement |
|---|---|---|---|---|
| 2025 | $7,326 | $514,100 | $237,000 | $277,100 |
| 2024 | $6,536 | $457,700 | $191,900 | $265,800 |
| 2023 | $6,264 | $423,500 | $181,000 | $242,500 |
| 2022 | $6,030 | $365,700 | $172,300 | $193,400 |
| 2021 | $5,805 | $339,100 | $156,500 | $182,600 |
| 2020 | $5,913 | $342,800 | $156,500 | $186,300 |
| 2019 | $5,822 | $339,500 | $156,500 | $183,000 |
| 2018 | $5,161 | $296,800 | $153,100 | $143,700 |
| 2017 | $5,076 | $291,900 | $153,100 | $138,800 |
| 2016 | $4,954 | $288,500 | $149,700 | $138,800 |
| 2015 | $4,768 | $285,000 | $157,900 | $127,100 |
| 2014 | $4,705 | $283,600 | $157,900 | $125,700 |
Source: Public Records
Map
Nearby Homes
- 13 Deacon St
- 460 Whitney St
- 281 Whitney St
- 14 Vanessa Dr
- 6 Vanessa Dr
- 6 Silas Dr
- 6 Macalister Dr
- 405 Whitney St
- 107 Washburn St
- 85 Hudson St Unit 85
- 86 Whitney St
- 26 Maple St
- 18 Alden Dr Unit 3
- 38 Mohawk Dr
- 0 Newton St
- 75 Newton St
- 490 Main St Unit 301
- 490 Main St Unit 101
- 5 Swan View Common Dr
- 245 Brewer St