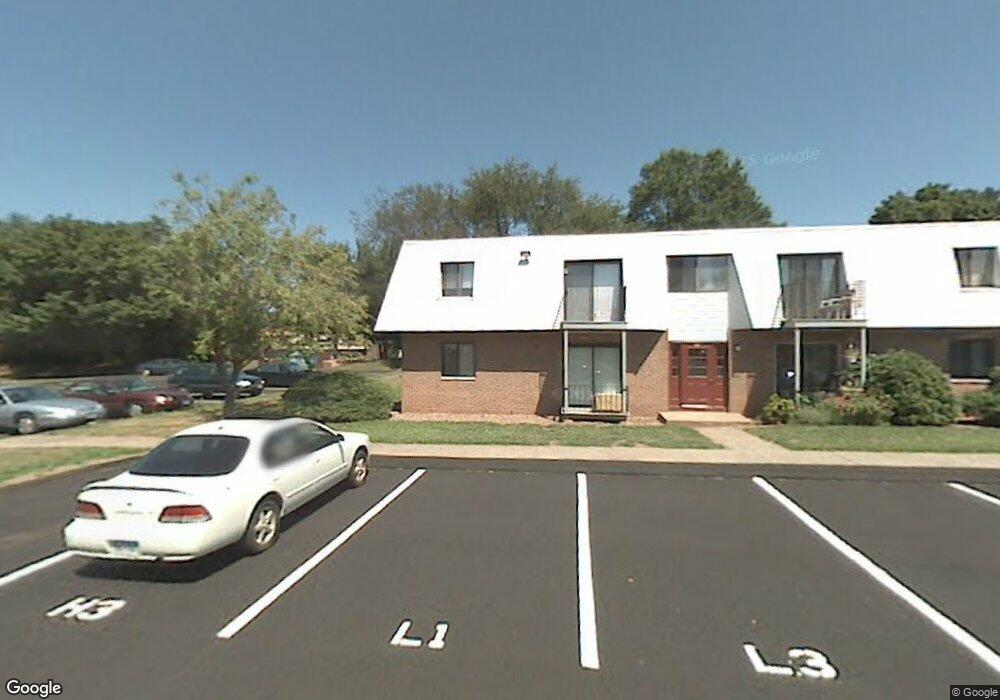
268 Richard St Unit 1 Newington, CT 06111
Estimated Value: $194,097 - $212,000
2
Beds
1
Bath
840
Sq Ft
$241/Sq Ft
Est. Value
About This Home
This home is located at 268 Richard St Unit 1, Newington, CT 06111 and is currently estimated at $202,774, approximately $241 per square foot. 268 Richard St Unit 1 is a home located in Hartford County with nearby schools including John Paterson School, John Wallace Middle School, and Newington High School.
Ownership History
Date
Name
Owned For
Owner Type
Purchase Details
Closed on
Sep 15, 2008
Sold by
Babu Sunil and Babu Bijily
Bought by
George Annamma
Current Estimated Value
Home Financials for this Owner
Home Financials are based on the most recent Mortgage that was taken out on this home.
Original Mortgage
$105,300
Interest Rate
6.58%
Purchase Details
Closed on
Jun 13, 2005
Sold by
Carducci Sharon
Bought by
Babu Sunil and Babu Bijlly
Home Financials for this Owner
Home Financials are based on the most recent Mortgage that was taken out on this home.
Original Mortgage
$86,400
Interest Rate
5.79%
Purchase Details
Closed on
Apr 1, 2004
Sold by
Peter Gustavson Ft and Gustavson Peter R
Bought by
Carducci Sharon H
Create a Home Valuation Report for This Property
The Home Valuation Report is an in-depth analysis detailing your home's value as well as a comparison with similar homes in the area
Home Values in the Area
Average Home Value in this Area
Purchase History
| Date | Buyer | Sale Price | Title Company |
|---|---|---|---|
| George Annamma | $117,000 | -- | |
| Babu Sunil | $108,000 | -- | |
| Carducci Sharon H | $71,000 | -- |
Source: Public Records
Mortgage History
| Date | Status | Borrower | Loan Amount |
|---|---|---|---|
| Closed | Carducci Sharon H | $105,300 | |
| Previous Owner | Carducci Sharon H | $114,300 | |
| Previous Owner | Carducci Sharon H | $86,400 | |
| Previous Owner | Carducci Sharon H | $21,600 |
Source: Public Records
Tax History Compared to Growth
Tax History
| Year | Tax Paid | Tax Assessment Tax Assessment Total Assessment is a certain percentage of the fair market value that is determined by local assessors to be the total taxable value of land and additions on the property. | Land | Improvement |
|---|---|---|---|---|
| 2025 | $2,432 | $60,840 | $0 | $60,840 |
| 2024 | $2,440 | $61,500 | $0 | $61,500 |
| 2023 | $2,359 | $61,500 | $0 | $61,500 |
| 2022 | $2,367 | $61,500 | $0 | $61,500 |
| 2021 | $2,387 | $61,500 | $0 | $61,500 |
| 2020 | $2,306 | $58,710 | $0 | $58,710 |
| 2019 | $2,316 | $58,710 | $0 | $58,710 |
| 2018 | $2,260 | $58,710 | $0 | $58,710 |
| 2017 | $2,148 | $58,710 | $0 | $58,710 |
| 2016 | $2,099 | $58,710 | $0 | $58,710 |
| 2014 | $1,952 | $56,140 | $0 | $56,140 |
Source: Public Records
Map
Nearby Homes
- 2990 Berlin Turnpike
- 38 Robin Brook Dr
- 212 Church St
- 2950 Berlin Turnpike
- 43 Steeplechase Dr Unit 43
- 170 Church St
- 660/674 Church Rear St
- 22 Apple Hill
- 120 Fox Run Ct
- 57 Stonehedge Dr
- 53 Salem Dr
- 9 Coachmen Ln
- 14 Kowal Ct
- 19 Sunnybrook Dr
- 235 Orchard Ave
- 103 Hickory Hill Ln
- 11 Eleanor Place
- 129 Glenview Dr
- 35 Woodsedge Dr Unit 4C
- 15 Woodsedge Dr Unit 6C
- 268 Richard St Unit 3
- 274 Richard St Unit 1
- 232 Richard St Unit 2
- 272 Richard St Unit 2
- 274 Richard St Unit 3
- 270 Richard St Unit 1
- 278 Richard St Unit 1
- 274 Richard St Unit 2
- 272 Richard St Unit 1
- 278 Richard St Unit 2
- 278 Richard St Unit 4
- 276 Richard St Unit 3
- 270 Richard St Unit 3
- 270 Richard St Unit 4
- 274 Richard St Unit 4
- 232 Richard St Unit 1
- 232 Richard St Unit 4
- 272 Richard St Unit 4
- 270 Richard St Unit 2
- 276 Richard St Unit 1