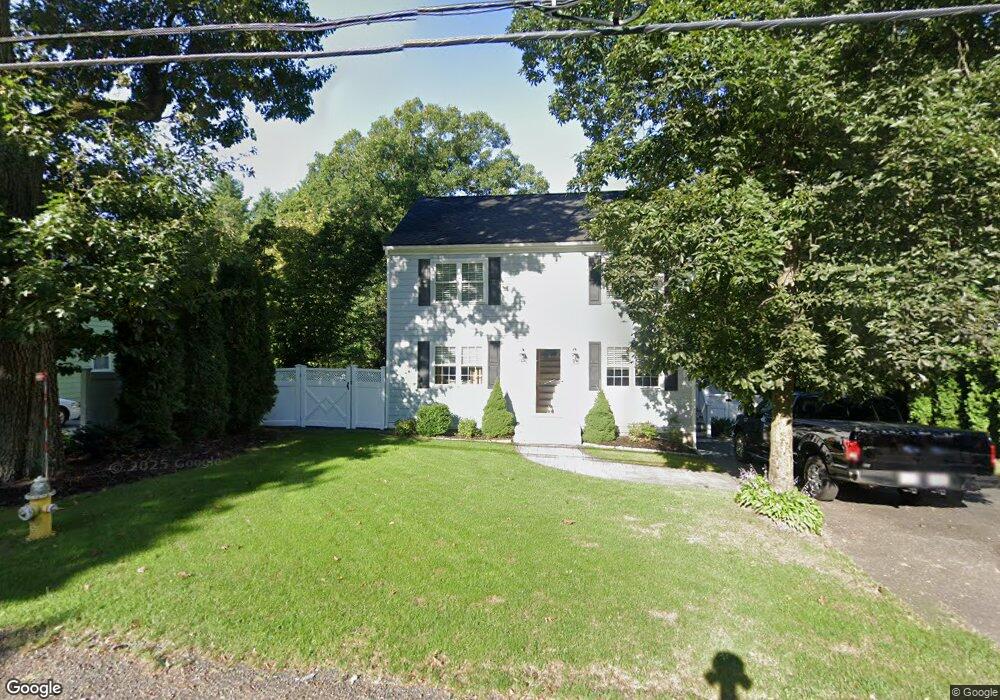
268 Taunton St Wrentham, MA 02093
Estimated Value: $624,224 - $682,000
3
Beds
2
Baths
1,656
Sq Ft
$390/Sq Ft
Est. Value
About This Home
This home is located at 268 Taunton St, Wrentham, MA 02093 and is currently estimated at $646,556, approximately $390 per square foot. 268 Taunton St is a home located in Norfolk County with nearby schools including Delaney Elementary School, Charles E Roderick, and Cadence Academy Preschool - North Attleborough.
Ownership History
Date
Name
Owned For
Owner Type
Purchase Details
Closed on
Nov 4, 2022
Sold by
Mullaley Sharon A
Bought by
Sharon Mullaley Ft and Mullaley
Current Estimated Value
Purchase Details
Closed on
Jan 17, 2020
Sold by
Sullivan Patrick J and Mullaley Sharon A
Bought by
Mullaley Sharon A
Home Financials for this Owner
Home Financials are based on the most recent Mortgage that was taken out on this home.
Original Mortgage
$332,733
Interest Rate
3.7%
Mortgage Type
New Conventional
Purchase Details
Closed on
Oct 19, 2018
Sold by
Sullivan Patrick J
Bought by
Sullivan Patrick J and Mullaley Sharon A
Purchase Details
Closed on
Aug 9, 2010
Sold by
Us Bk
Bought by
Sullivan Patrick J
Home Financials for this Owner
Home Financials are based on the most recent Mortgage that was taken out on this home.
Original Mortgage
$50,000
Interest Rate
4.73%
Mortgage Type
Purchase Money Mortgage
Purchase Details
Closed on
Jul 30, 2010
Sold by
Snow Charles E and Us Bk
Bought by
Us Bk
Home Financials for this Owner
Home Financials are based on the most recent Mortgage that was taken out on this home.
Original Mortgage
$50,000
Interest Rate
4.73%
Mortgage Type
Purchase Money Mortgage
Purchase Details
Closed on
Jun 22, 2006
Sold by
Kennos Gloria M and Snow Gloria M
Bought by
Snow Charles E and Gellman Steven J
Home Financials for this Owner
Home Financials are based on the most recent Mortgage that was taken out on this home.
Original Mortgage
$269,000
Interest Rate
6.59%
Mortgage Type
Purchase Money Mortgage
Purchase Details
Closed on
Nov 19, 2004
Sold by
Kennos Gloria M and Snow Gloria M
Bought by
Kennos Gloria M and Kennos Spiridon
Create a Home Valuation Report for This Property
The Home Valuation Report is an in-depth analysis detailing your home's value as well as a comparison with similar homes in the area
Home Values in the Area
Average Home Value in this Area
Purchase History
| Date | Buyer | Sale Price | Title Company |
|---|---|---|---|
| Sharon Mullaley Ft | -- | None Available | |
| Mullaley Sharon A | -- | None Available | |
| Sullivan Patrick J | -- | -- | |
| Sullivan Patrick J | $137,000 | -- | |
| Sullivan Patrick J | $137,000 | -- | |
| Us Bk | $110,339 | -- | |
| Us Bk | $110,339 | -- | |
| Snow Charles E | $375,000 | -- | |
| Snow Charles E | $375,000 | -- | |
| Kennos Gloria M | -- | -- | |
| Kennos Gloria M | -- | -- |
Source: Public Records
Mortgage History
| Date | Status | Borrower | Loan Amount |
|---|---|---|---|
| Previous Owner | Mullaley Sharon A | $332,733 | |
| Previous Owner | Kennos Gloria M | $40,000 | |
| Previous Owner | Sullivan Patrick J | $50,000 | |
| Previous Owner | Snow Charles E | $269,000 |
Source: Public Records
Tax History Compared to Growth
Tax History
| Year | Tax Paid | Tax Assessment Tax Assessment Total Assessment is a certain percentage of the fair market value that is determined by local assessors to be the total taxable value of land and additions on the property. | Land | Improvement |
|---|---|---|---|---|
| 2025 | $5,895 | $508,600 | $251,100 | $257,500 |
| 2024 | $5,680 | $473,300 | $251,100 | $222,200 |
| 2023 | $5,312 | $420,900 | $228,200 | $192,700 |
| 2022 | $5,028 | $367,800 | $205,400 | $162,400 |
| 2021 | $4,684 | $332,900 | $183,400 | $149,500 |
| 2020 | $4,671 | $327,800 | $167,400 | $160,400 |
| 2019 | $4,311 | $305,300 | $152,200 | $153,100 |
| 2018 | $4,790 | $336,400 | $152,200 | $184,200 |
| 2017 | $4,477 | $314,200 | $149,200 | $165,000 |
| 2016 | $4,404 | $308,400 | $144,900 | $163,500 |
| 2015 | $4,242 | $283,200 | $139,300 | $143,900 |
| 2014 | $4,174 | $272,600 | $134,000 | $138,600 |
Source: Public Records
Map
Nearby Homes
- 319 Taunton St
- 11 Earle Stewart Ln
- 10 Nature View Dr
- 15 Nature View Dr
- 155 Clark Rd Unit 155
- Lot 1 - Blueberry 2 Car Plan at King Philip Estates
- Lot 8 - Blueberry 2 Car Plan at King Philip Estates
- Lot 5 - Hughes 2 car Plan at King Philip Estates
- Lot 6 - Blueberry 3 Car Plan at King Philip Estates
- Lot 2 - Camden 2 Car Plan at King Philip Estates
- Lot 7 - Cedar Plan at King Philip Estates
- Lot 4 - Hemingway 2 Car Plan at King Philip Estates
- Lot 3 - Blueberry 2 Car Plan at King Philip Estates
- Lot 3 - 14 Earle Stewart Ln
- 131 Creek St Unit 7
- 362 East St
- 120 Hawes St
- 1 Lorraine Metcalf Dr
- 791 South St Unit 5
- 270 Dedham St