Estimated Value: $345,000 - $419,000
4
Beds
4
Baths
2,516
Sq Ft
$151/Sq Ft
Est. Value
About This Home
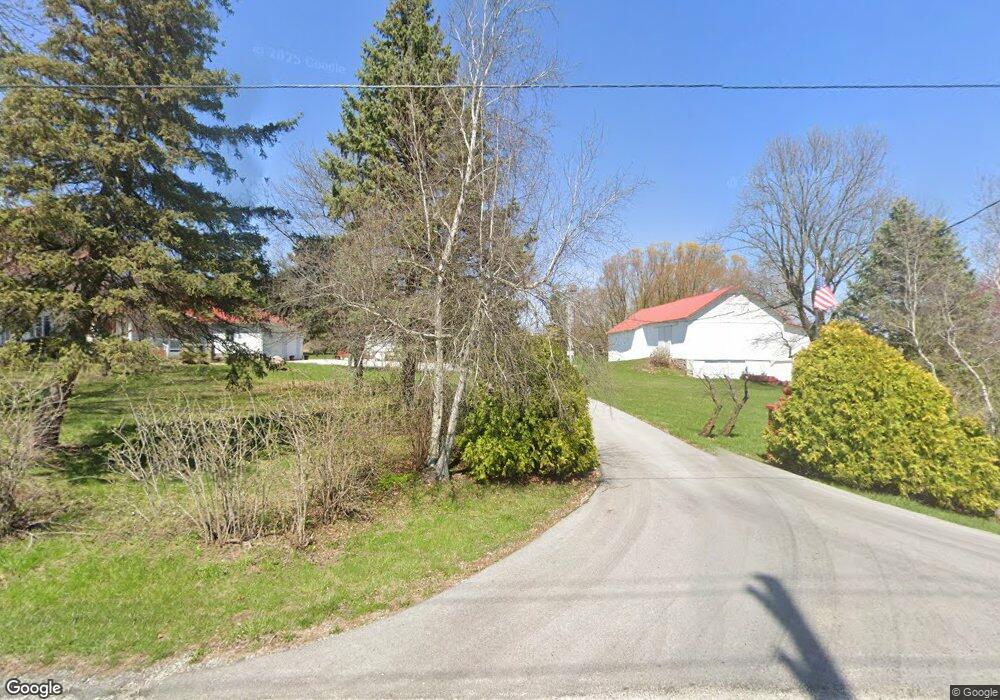
This home is located at 268 W 650 S, Peru, IN 46970 and is currently estimated at $379,750, approximately $150 per square foot. 268 W 650 S is a home located in Miami County with nearby schools including Pipe Creek Elementary School, Maconaquah Elementary School, and Maconaquah Middle School.
Ownership History
Date
Name
Owned For
Owner Type
Purchase Details
Closed on
Jun 3, 2021
Sold by
Hammond Gregg K and Hammond Kaili W
Bought by
Hammond Gregg K and Hammond Kaili W
Current Estimated Value
Purchase Details
Closed on
Apr 5, 2017
Sold by
Hammond Gregg K and Hammond Kaili W
Bought by
Hammond Gregg K and Hammond Kaili W
Purchase Details
Closed on
Dec 29, 2015
Sold by
Hannond Gregg K and Hammond Kaili W
Bought by
Real Estate Trust Of Gregg K Hammond And and Hammond Kaili W
Purchase Details
Closed on
Oct 28, 2013
Sold by
Sebastian Douglas D and Sebastian Nancy L
Bought by
Hammond Gregg K and Hammond Kaili W
Home Financials for this Owner
Home Financials are based on the most recent Mortgage that was taken out on this home.
Original Mortgage
$600,000
Interest Rate
4.24%
Mortgage Type
Purchase Money Mortgage
Purchase Details
Closed on
Jan 31, 2010
Sold by
Sebastian Douglas D
Bought by
Hammond Gregg K and Hammond Kaili W
Create a Home Valuation Report for This Property
The Home Valuation Report is an in-depth analysis detailing your home's value as well as a comparison with similar homes in the area
Home Values in the Area
Average Home Value in this Area
Purchase History
| Date | Buyer | Sale Price | Title Company |
|---|---|---|---|
| Hammond Gregg K | -- | None Available | |
| Hammond Gregg K | -- | None Available | |
| Real Estate Trust Of Gregg K Hammond And | -- | None Available | |
| Hammond Gregg K | -- | None Available | |
| Hammond Gregg K | $220,000 | -- |
Source: Public Records
Mortgage History
| Date | Status | Borrower | Loan Amount |
|---|---|---|---|
| Closed | Hammond Gregg K | $600,000 |
Source: Public Records
Tax History Compared to Growth
Tax History
| Year | Tax Paid | Tax Assessment Tax Assessment Total Assessment is a certain percentage of the fair market value that is determined by local assessors to be the total taxable value of land and additions on the property. | Land | Improvement |
|---|---|---|---|---|
| 2024 | $1,931 | $288,400 | $40,300 | $248,100 |
| 2023 | $1,931 | $291,300 | $40,300 | $251,000 |
| 2022 | $1,842 | $291,400 | $40,300 | $251,100 |
| 2021 | $1,790 | $268,500 | $40,300 | $228,200 |
| 2020 | $2,277 | $185,400 | $40,300 | $145,100 |
| 2019 | $1,236 | $185,500 | $40,300 | $145,200 |
| 2018 | $793 | $162,900 | $40,300 | $122,600 |
| 2017 | $639 | $146,900 | $32,600 | $114,300 |
| 2016 | $635 | $147,200 | $32,800 | $114,400 |
| 2014 | $636 | $144,100 | $32,900 | $111,200 |
| 2013 | -- | $141,400 | $31,200 | $110,200 |
Source: Public Records
Map
Nearby Homes