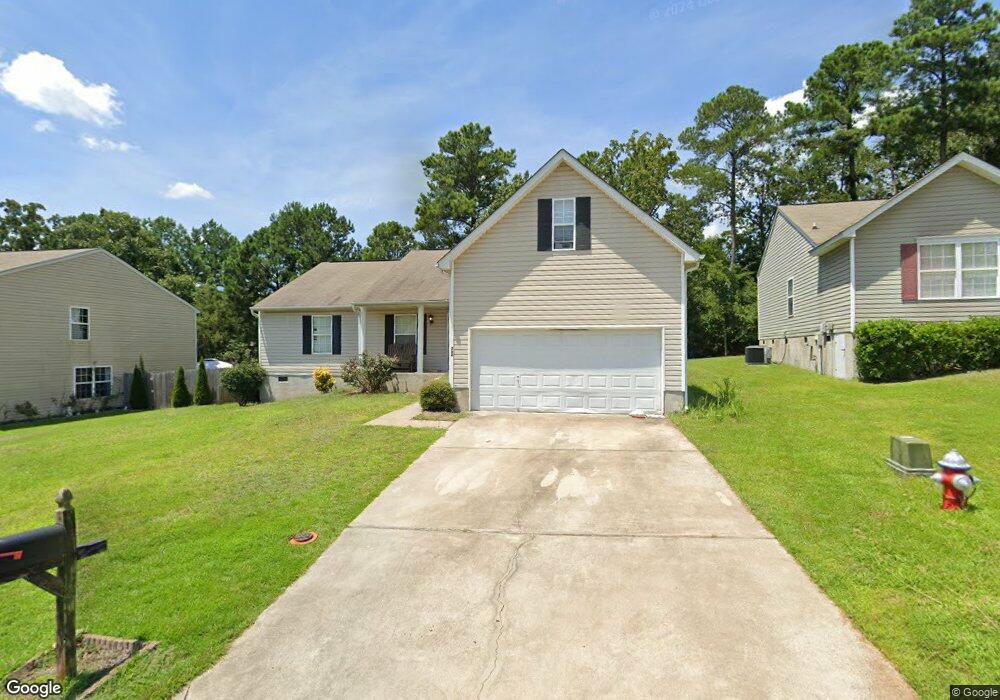
268 Walkbridge Way Chapin, SC 29036
Estimated Value: $224,000 - $266,000
3
Beds
2
Baths
1,699
Sq Ft
$145/Sq Ft
Est. Value
About This Home
This home is located at 268 Walkbridge Way, Chapin, SC 29036 and is currently estimated at $246,176, approximately $144 per square foot. 268 Walkbridge Way is a home located in Lexington County with nearby schools including Chapin Elementary School, Chapin Intermediate, and Chapin High School.
Ownership History
Date
Name
Owned For
Owner Type
Purchase Details
Closed on
Feb 13, 2025
Sold by
Szymanski Greg M
Bought by
Szymanski Amber
Current Estimated Value
Home Financials for this Owner
Home Financials are based on the most recent Mortgage that was taken out on this home.
Original Mortgage
$132,000
Outstanding Balance
$131,235
Interest Rate
7.04%
Mortgage Type
New Conventional
Estimated Equity
$114,941
Purchase Details
Closed on
Mar 26, 2008
Sold by
Nvr Rymarc Homes Of South Carolina Llc
Bought by
Szymanski Greg M and Szymanski Amber
Home Financials for this Owner
Home Financials are based on the most recent Mortgage that was taken out on this home.
Original Mortgage
$121,785
Interest Rate
5.68%
Mortgage Type
Purchase Money Mortgage
Purchase Details
Closed on
Jan 10, 2008
Sold by
Five Star Development Llc
Bought by
Nvr Rymarc Homes Of South Carolina Llc
Create a Home Valuation Report for This Property
The Home Valuation Report is an in-depth analysis detailing your home's value as well as a comparison with similar homes in the area
Home Values in the Area
Average Home Value in this Area
Purchase History
| Date | Buyer | Sale Price | Title Company |
|---|---|---|---|
| Szymanski Amber | -- | None Listed On Document | |
| Szymanski Amber | -- | None Listed On Document | |
| Szymanski Greg M | $131,785 | None Available | |
| Nvr Rymarc Homes Of South Carolina Llc | $41,000 | None Available |
Source: Public Records
Mortgage History
| Date | Status | Borrower | Loan Amount |
|---|---|---|---|
| Open | Szymanski Amber | $132,000 | |
| Closed | Szymanski Amber | $132,000 | |
| Previous Owner | Szymanski Greg M | $121,785 |
Source: Public Records
Tax History Compared to Growth
Tax History
| Year | Tax Paid | Tax Assessment Tax Assessment Total Assessment is a certain percentage of the fair market value that is determined by local assessors to be the total taxable value of land and additions on the property. | Land | Improvement |
|---|---|---|---|---|
| 2024 | $998 | $6,063 | $983 | $5,080 |
| 2023 | $927 | $6,060 | $983 | $5,077 |
| 2022 | $936 | $6,060 | $983 | $5,077 |
| 2020 | $980 | $6,060 | $983 | $5,077 |
| 2019 | $867 | $5,269 | $800 | $4,469 |
| 2018 | $763 | $5,269 | $800 | $4,469 |
| 2017 | $743 | $5,269 | $800 | $4,469 |
| 2016 | $762 | $5,269 | $800 | $4,469 |
| 2014 | $820 | $5,686 | $800 | $4,886 |
| 2013 | -- | $5,690 | $800 | $4,890 |
Source: Public Records
Map
Nearby Homes
- 100 Palm St
- 0 Dreher Island Rd Unit 21647709
- 0 Dreher Island Rd Unit 587193
- 117 Bay Front Dr
- 510 Lilypad Ct
- 3006 Chilmark Rd
- 409 Dutchman Shores Cir
- 171 Elm Creek Dr
- 147 Ventnor Ave
- 108 Pennsylvania Ct
- 161 Dutchman Shores Cir
- 125 Northshore Dr
- 100 Baltic Ct
- 417 Northshore Ct
- 412 Northshore Ct
- 908 Old Lexington Hwy
- 814 Dutchmaster Dr
- 1431 Saugus Ct
- 129 Monroe Preserve Dr
- 540 Lakeshore Dr
- 264 Walkbridge Way
- 272 Walkbridge Way
- 276 Walkbridge Way
- 260 Walkbridge Way
- 129 Shipyard Blvd
- 133 Shipyard Blvd
- 125 Shipyard Blvd
- 267 Walkbridge Way
- 256 Walkbridge Way
- 280 Walkbridge Way
- 259 Walkbridge Way
- 271 Walkbridge Way
- 275 Walkbridge Way
- 283 Walkbridge Way
- 137 Shipyard Blvd
- 252 Walkbridge Way
- 121 Shipyard Blvd
- 255 Walkbridge Way
- 284 Walkbridge Way
- 128 Shipyard Blvd