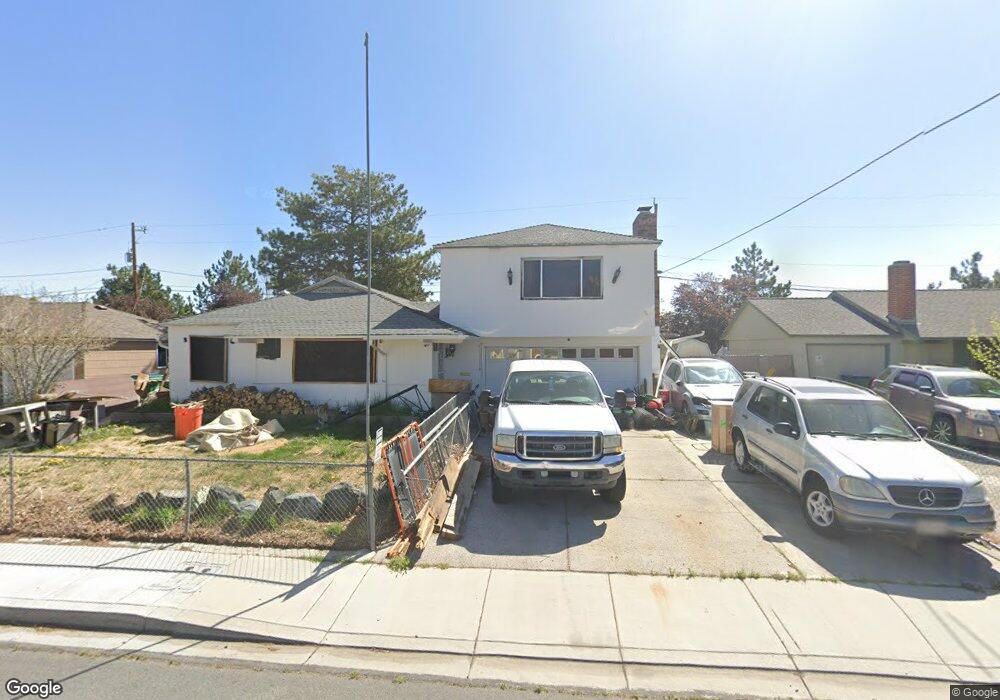
2680 11th St Sparks, NV 89431
North Rock NeighborhoodEstimated Value: $433,000 - $471,000
3
Beds
2
Baths
1,679
Sq Ft
$265/Sq Ft
Est. Value
About This Home
This home is located at 2680 11th St, Sparks, NV 89431 and is currently estimated at $445,310, approximately $265 per square foot. 2680 11th St is a home located in Washoe County with nearby schools including Alice Maxwell Elementary School, Sparks Middle School, and Sparks High School.
Ownership History
Date
Name
Owned For
Owner Type
Purchase Details
Closed on
Jan 12, 2009
Sold by
Wachovia Mortgage Fsb
Bought by
Molina Raymond P
Current Estimated Value
Home Financials for this Owner
Home Financials are based on the most recent Mortgage that was taken out on this home.
Original Mortgage
$155,000
Outstanding Balance
$99,583
Interest Rate
5.49%
Mortgage Type
VA
Estimated Equity
$345,727
Purchase Details
Closed on
Nov 12, 2008
Sold by
Ciccotti Lisa M
Bought by
Wachovia Mortgage Fsb and World Savings Bank Fsb
Purchase Details
Closed on
Sep 29, 2000
Sold by
Wheeler Frank E and Wheeler Loretta J
Bought by
Ciccotti Lisa M
Home Financials for this Owner
Home Financials are based on the most recent Mortgage that was taken out on this home.
Original Mortgage
$125,900
Interest Rate
7.98%
Create a Home Valuation Report for This Property
The Home Valuation Report is an in-depth analysis detailing your home's value as well as a comparison with similar homes in the area
Home Values in the Area
Average Home Value in this Area
Purchase History
| Date | Buyer | Sale Price | Title Company |
|---|---|---|---|
| Molina Raymond P | $155,000 | Stewart Title Of Nevada | |
| Wachovia Mortgage Fsb | $145,960 | Ticor Title Reno | |
| Ciccotti Lisa M | $140,000 | Western Title Inc |
Source: Public Records
Mortgage History
| Date | Status | Borrower | Loan Amount |
|---|---|---|---|
| Open | Molina Raymond P | $155,000 | |
| Previous Owner | Ciccotti Lisa M | $125,900 |
Source: Public Records
Tax History Compared to Growth
Tax History
| Year | Tax Paid | Tax Assessment Tax Assessment Total Assessment is a certain percentage of the fair market value that is determined by local assessors to be the total taxable value of land and additions on the property. | Land | Improvement |
|---|---|---|---|---|
| 2025 | $930 | $54,790 | $31,325 | $23,465 |
| 2024 | $97 | $53,295 | $30,100 | $23,195 |
| 2023 | $683 | $51,252 | $29,890 | $21,362 |
| 2022 | $918 | $42,519 | $25,095 | $17,424 |
| 2021 | $853 | $33,735 | $16,765 | $16,970 |
| 2020 | $800 | $33,014 | $16,345 | $16,669 |
| 2019 | $764 | $31,712 | $15,890 | $15,822 |
| 2018 | $730 | $26,402 | $11,235 | $15,167 |
| 2017 | $698 | $25,046 | $10,150 | $14,896 |
| 2016 | $680 | $23,076 | $8,225 | $14,851 |
| 2015 | $678 | $21,947 | $7,140 | $14,807 |
| 2014 | $658 | $20,358 | $6,440 | $13,918 |
| 2013 | -- | $17,515 | $3,955 | $13,560 |
Source: Public Records
Map
Nearby Homes
- 1125 Dodson Way
- 1160 York Way
- 1345 Plymouth Way
- 1110 Xman Way
- 0 N Mccarran Blvd Unit 250052909
- 3269 Valley Forge Way
- 1620 Gault Way
- 780 Emerson Way
- 1595 York Way
- 2154 Oppio St
- 1124 Sbragia Way
- 465 Lenwood Dr
- 1731 Gault Way Unit D
- 1003 Sbragia Way
- 5530 High Rock Way
- 1705 9th St
- 5650 Wedekind Rd
- 1655 Byrd Dr
- 1121 Greenbrae Dr
- 1799 Vance Way